|
Download Data (XLS File) |
|
||||||||
|
||||||||
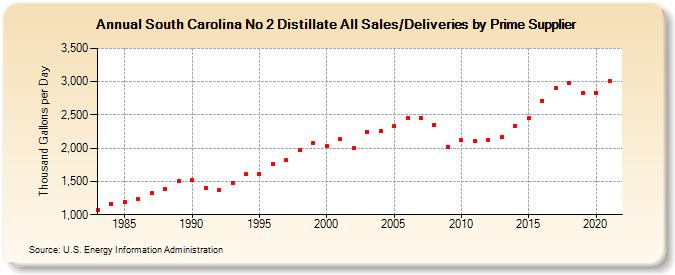
| South Carolina No 2 Distillate All Sales/Deliveries by Prime Supplier (Thousand Gallons per Day) | ||||||||
| Decade | Year-0 | Year-1 | Year-2 | Year-3 | Year-4 | Year-5 | Year-6 | Year-7 | Year-8 | Year-9 |
|---|---|---|---|---|---|---|---|---|---|---|
| 1980's | 1,076.8 | 1,167.1 | 1,197.9 | 1,234.1 | 1,325.9 | 1,386.9 | 1,500.3 | |||
| 1990's | 1,519.6 | 1,403.6 | 1,367.1 | 1,476.4 | 1,607.3 | 1,605.3 | 1,762.8 | 1,819.1 | 1,965.4 | 2,081.3 |
| 2000's | 2,031.2 | 2,134.3 | 2,000.3 | 2,245.4 | 2,255.6 | 2,333.1 | 2,450.1 | 2,452.5 | 2,352.1 | 2,024.9 |
| 2010's | 2,117.0 | 2,107.3 | 2,120.6 | 2,173.5 | 2,340.9 | 2,449.0 | 2,713.6 | 2,910.0 | 2,984.7 | 2,832.0 |
| 2020's | 2,834.9 |
| - = No Data Reported; -- = Not Applicable; NA = Not Available; W = Withheld to avoid disclosure of individual company data. |
| Release Date: 6/1/2022 |
| Next Release Date: TBD |