|
Download Data (XLS File) |
|
||||||||
|
||||||||
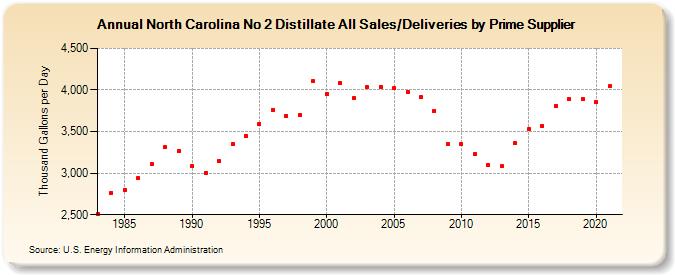
| North Carolina No 2 Distillate All Sales/Deliveries by Prime Supplier (Thousand Gallons per Day) | ||||||||
| Decade | Year-0 | Year-1 | Year-2 | Year-3 | Year-4 | Year-5 | Year-6 | Year-7 | Year-8 | Year-9 |
|---|---|---|---|---|---|---|---|---|---|---|
| 1980's | 2,510.3 | 2,761.9 | 2,803.0 | 2,936.5 | 3,108.1 | 3,312.0 | 3,263.2 | |||
| 1990's | 3,084.4 | 3,004.9 | 3,147.4 | 3,350.5 | 3,451.1 | 3,593.3 | 3,763.0 | 3,692.0 | 3,700.5 | 4,103.5 |
| 2000's | 3,954.3 | 4,085.5 | 3,901.8 | 4,035.2 | 4,040.8 | 4,020.6 | 3,974.4 | 3,911.8 | 3,750.9 | 3,346.9 |
| 2010's | 3,349.2 | 3,225.4 | 3,095.3 | 3,081.5 | 3,357.1 | 3,528.4 | 3,571.6 | 3,812.0 | 3,890.3 | 3,892.8 |
| 2020's | 3,857.5 |
| - = No Data Reported; -- = Not Applicable; NA = Not Available; W = Withheld to avoid disclosure of individual company data. |
| Release Date: 6/1/2022 |
| Next Release Date: TBD |