|
Download Data (XLS File) |
|
||||||||
|
||||||||
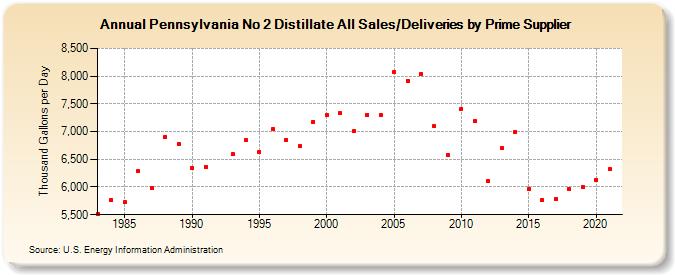
| Pennsylvania No 2 Distillate All Sales/Deliveries by Prime Supplier (Thousand Gallons per Day) | ||||||||
| Decade | Year-0 | Year-1 | Year-2 | Year-3 | Year-4 | Year-5 | Year-6 | Year-7 | Year-8 | Year-9 |
|---|---|---|---|---|---|---|---|---|---|---|
| 1980's | 5,517.6 | 5,765.6 | 5,720.7 | 6,283.0 | 5,975.6 | 6,897.8 | 6,777.7 | |||
| 1990's | 6,349.7 | 6,366.0 | W | 6,589.5 | 6,841.2 | 6,631.5 | 7,043.7 | 6,849.8 | 6,734.6 | 7,178.3 |
| 2000's | 7,291.3 | 7,330.1 | 7,004.4 | 7,304.6 | 7,298.7 | 8,081.6 | 7,919.7 | 8,029.3 | 7,091.2 | 6,584.3 |
| 2010's | 7,411.6 | 7,182.3 | 6,099.4 | 6,700.5 | 6,996.3 | 5,958.7 | 5,768.5 | 5,783.2 | 5,962.1 | 6,003.7 |
| 2020's | 6,127.4 |
| - = No Data Reported; -- = Not Applicable; NA = Not Available; W = Withheld to avoid disclosure of individual company data. |
| Release Date: 6/1/2022 |
| Next Release Date: TBD |