|
Download Data (XLS File) |
|
||||||||
|
||||||||
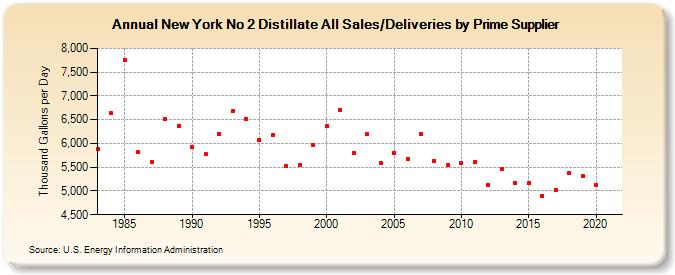
| New York No 2 Distillate All Sales/Deliveries by Prime Supplier (Thousand Gallons per Day) | ||||||||
| Decade | Year-0 | Year-1 | Year-2 | Year-3 | Year-4 | Year-5 | Year-6 | Year-7 | Year-8 | Year-9 |
|---|---|---|---|---|---|---|---|---|---|---|
| 1980's | 5,880.7 | 6,635.3 | 7,748.3 | 5,811.5 | 5,613.4 | 6,505.8 | 6,368.9 | |||
| 1990's | 5,921.0 | 5,767.7 | 6,196.3 | 6,684.2 | 6,511.0 | 6,082.7 | 6,183.2 | 5,519.9 | 5,547.9 | 5,970.8 |
| 2000's | 6,358.3 | 6,707.4 | 5,796.4 | 6,197.2 | 5,595.5 | 5,804.0 | 5,669.7 | 6,188.0 | 5,621.0 | 5,543.0 |
| 2010's | 5,584.6 | 5,618.5 | 5,133.8 | 5,466.7 | 5,157.7 | 5,164.7 | 4,897.8 | 5,020.7 | 5,370.8 | 5,306.9 |
| 2020's | 5,116.4 |
| - = No Data Reported; -- = Not Applicable; NA = Not Available; W = Withheld to avoid disclosure of individual company data. |
| Release Date: 6/1/2022 |
| Next Release Date: TBD |