|
Download Data (XLS File) |
|
||||||||
|
||||||||
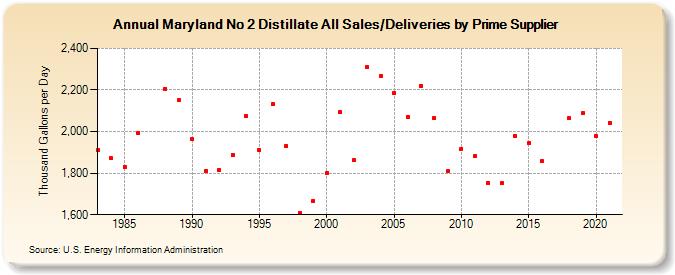
| Maryland No 2 Distillate All Sales/Deliveries by Prime Supplier (Thousand Gallons per Day) | ||||||||
| Decade | Year-0 | Year-1 | Year-2 | Year-3 | Year-4 | Year-5 | Year-6 | Year-7 | Year-8 | Year-9 |
|---|---|---|---|---|---|---|---|---|---|---|
| 1980's | 1,909.2 | 1,870.7 | 1,831.8 | 1,994.4 | W | 2,206.7 | 2,150.3 | |||
| 1990's | 1,962.2 | 1,809.9 | 1,815.0 | 1,888.2 | 2,074.3 | 1,909.7 | 2,132.1 | 1,931.4 | 1,609.4 | 1,667.8 |
| 2000's | 1,799.8 | 2,091.7 | 1,862.2 | 2,309.1 | 2,265.6 | 2,185.5 | 2,072.2 | 2,218.2 | 2,064.4 | 1,807.9 |
| 2010's | 1,918.4 | 1,880.5 | 1,752.1 | 1,750.8 | 1,977.0 | 1,944.1 | 1,856.8 | W | 2,063.1 | 2,087.3 |
| 2020's | 1,978.5 |
| - = No Data Reported; -- = Not Applicable; NA = Not Available; W = Withheld to avoid disclosure of individual company data. |
| Release Date: 6/1/2022 |
| Next Release Date: TBD |