|
Download Data (XLS File) |
|
||||||||
|
||||||||
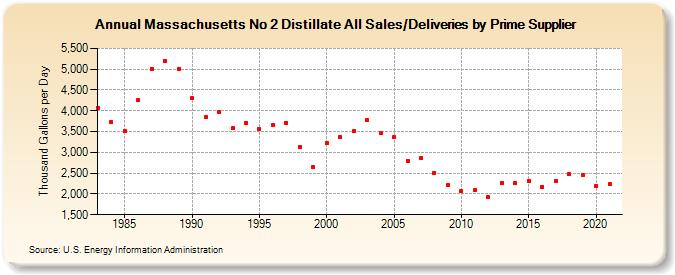
| Massachusetts No 2 Distillate All Sales/Deliveries by Prime Supplier (Thousand Gallons per Day) | ||||||||
| Decade | Year-0 | Year-1 | Year-2 | Year-3 | Year-4 | Year-5 | Year-6 | Year-7 | Year-8 | Year-9 |
|---|---|---|---|---|---|---|---|---|---|---|
| 1980's | 4,073.8 | 3,730.2 | 3,521.1 | 4,256.1 | 5,012.7 | 5,206.3 | 5,007.1 | |||
| 1990's | 4,305.2 | 3,838.9 | 3,965.0 | 3,573.5 | 3,713.4 | 3,553.6 | 3,654.0 | 3,707.5 | 3,134.7 | 2,645.8 |
| 2000's | 3,222.7 | 3,363.7 | 3,503.3 | 3,776.0 | 3,455.5 | 3,365.6 | 2,799.8 | 2,862.2 | 2,511.5 | 2,225.4 |
| 2010's | 2,059.7 | 2,088.0 | 1,925.8 | 2,271.4 | 2,265.1 | 2,302.7 | 2,172.2 | 2,305.2 | 2,472.9 | 2,460.7 |
| 2020's | 2,200.8 |
| - = No Data Reported; -- = Not Applicable; NA = Not Available; W = Withheld to avoid disclosure of individual company data. |
| Release Date: 6/1/2022 |
| Next Release Date: TBD |