|
Download Data (XLS File) |
|
||||||||
|
||||||||
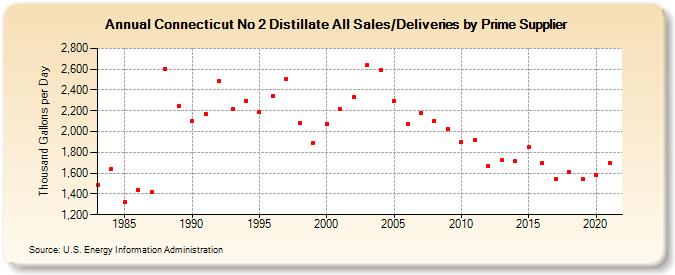
| Connecticut No 2 Distillate All Sales/Deliveries by Prime Supplier (Thousand Gallons per Day) | ||||||||
| Decade | Year-0 | Year-1 | Year-2 | Year-3 | Year-4 | Year-5 | Year-6 | Year-7 | Year-8 | Year-9 |
|---|---|---|---|---|---|---|---|---|---|---|
| 1980's | 1,487.4 | 1,639.9 | 1,321.6 | 1,436.4 | 1,418.7 | 2,603.6 | 2,244.4 | |||
| 1990's | 2,102.7 | 2,172.3 | 2,482.0 | 2,214.0 | 2,296.4 | 2,184.3 | 2,345.4 | 2,503.3 | 2,083.1 | 1,893.1 |
| 2000's | 2,072.7 | 2,214.0 | 2,331.1 | 2,643.5 | 2,594.1 | 2,296.6 | 2,072.2 | 2,180.4 | 2,106.3 | 2,025.6 |
| 2010's | 1,902.3 | 1,920.9 | 1,669.3 | 1,723.1 | 1,712.6 | 1,851.2 | 1,697.4 | 1,546.2 | 1,607.1 | 1,544.3 |
| 2020's | 1,578.3 |
| - = No Data Reported; -- = Not Applicable; NA = Not Available; W = Withheld to avoid disclosure of individual company data. |
| Release Date: 6/1/2022 |
| Next Release Date: TBD |