|
Download Data (XLS File) |
|
||||||||
|
||||||||
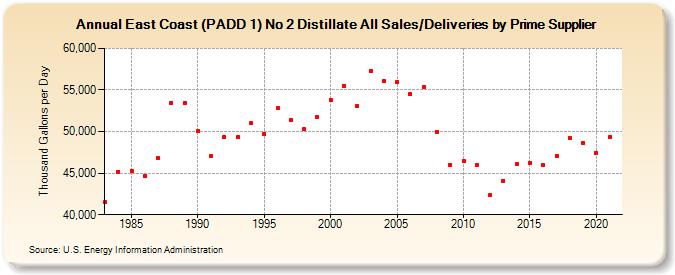
| East Coast (PADD 1) No 2 Distillate All Sales/Deliveries by Prime Supplier (Thousand Gallons per Day) | ||||||||
| Decade | Year-0 | Year-1 | Year-2 | Year-3 | Year-4 | Year-5 | Year-6 | Year-7 | Year-8 | Year-9 |
|---|---|---|---|---|---|---|---|---|---|---|
| 1980's | 41,508.3 | 45,196.2 | 45,296.8 | 44,674.0 | 46,875.6 | 53,476.4 | 53,449.2 | |||
| 1990's | 50,084.8 | 47,019.7 | 49,350.4 | 49,395.4 | 51,022.9 | 49,690.1 | 52,820.1 | 51,379.5 | 50,268.6 | 51,709.9 |
| 2000's | 53,808.3 | 55,516.7 | 53,069.1 | 57,303.5 | 56,074.2 | 55,961.9 | 54,492.1 | 55,302.2 | 49,966.6 | 46,003.4 |
| 2010's | 46,441.6 | 45,918.8 | 42,389.8 | 44,096.0 | 46,057.4 | 46,220.9 | 45,944.5 | 47,108.3 | 49,267.3 | 48,646.5 |
| 2020's | 47,445.9 |
| - = No Data Reported; -- = Not Applicable; NA = Not Available; W = Withheld to avoid disclosure of individual company data. |
| Release Date: 6/1/2022 |
| Next Release Date: TBD |