|
Download Data (XLS File) |
|
||||||||
|
||||||||
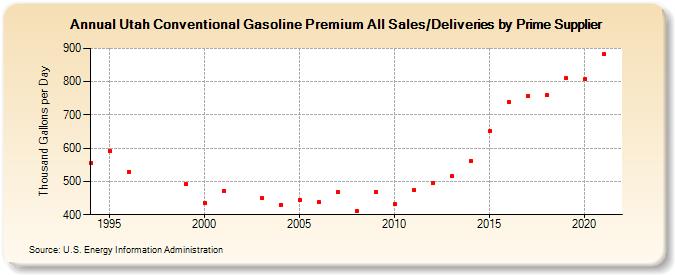
| Utah Conventional Gasoline Premium All Sales/Deliveries by Prime Supplier (Thousand Gallons per Day) | ||||||||
| Decade | Year-0 | Year-1 | Year-2 | Year-3 | Year-4 | Year-5 | Year-6 | Year-7 | Year-8 | Year-9 |
|---|---|---|---|---|---|---|---|---|---|---|
| 1990's | 554.8 | 591.6 | 528.5 | W | W | 491.5 | ||||
| 2000's | 435.7 | 471.3 | W | 450.4 | 430.7 | 445.0 | 437.2 | 469.3 | 410.5 | 468.7 |
| 2010's | 431.2 | 474.8 | 493.9 | 515.2 | 562.7 | 650.9 | 737.5 | 756.9 | 758.9 | 810.0 |
| 2020's | 806.9 |
| - = No Data Reported; -- = Not Applicable; NA = Not Available; W = Withheld to avoid disclosure of individual company data. |
| Release Date: 6/1/2022 |
| Next Release Date: TBD |