|
Download Data (XLS File) |
|
||||||||
|
||||||||
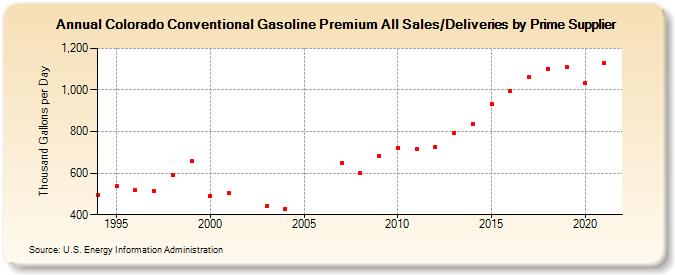
| Colorado Conventional Gasoline Premium All Sales/Deliveries by Prime Supplier (Thousand Gallons per Day) | ||||||||
| Decade | Year-0 | Year-1 | Year-2 | Year-3 | Year-4 | Year-5 | Year-6 | Year-7 | Year-8 | Year-9 |
|---|---|---|---|---|---|---|---|---|---|---|
| 1990's | 493.7 | 536.8 | 517.0 | 514.9 | 590.5 | 658.7 | ||||
| 2000's | 489.7 | 503.9 | W | 441.5 | 429.4 | W | W | 649.5 | 600.3 | 683.9 |
| 2010's | 722.7 | 714.7 | 727.4 | 793.7 | 835.7 | 934.6 | 997.1 | 1,060.3 | 1,102.6 | 1,112.0 |
| 2020's | 1,032.2 |
| - = No Data Reported; -- = Not Applicable; NA = Not Available; W = Withheld to avoid disclosure of individual company data. |
| Release Date: 6/1/2022 |
| Next Release Date: TBD |