|
Download Data (XLS File) |
|
||||||||
|
||||||||
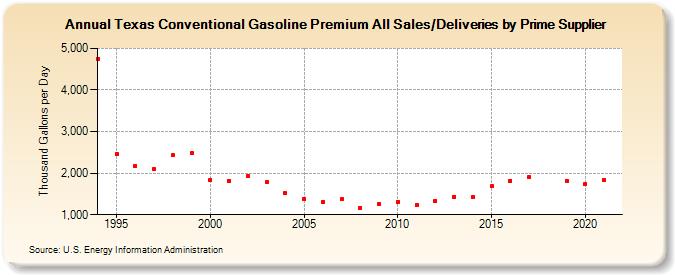
| Texas Conventional Gasoline Premium All Sales/Deliveries by Prime Supplier (Thousand Gallons per Day) | ||||||||
| Decade | Year-0 | Year-1 | Year-2 | Year-3 | Year-4 | Year-5 | Year-6 | Year-7 | Year-8 | Year-9 |
|---|---|---|---|---|---|---|---|---|---|---|
| 1990's | 4,754.1 | 2,467.0 | 2,182.2 | 2,091.4 | 2,429.9 | 2,483.7 | ||||
| 2000's | 1,844.2 | 1,818.0 | 1,935.0 | 1,778.2 | 1,515.7 | 1,385.6 | 1,303.3 | 1,373.9 | 1,165.9 | 1,262.8 |
| 2010's | 1,312.2 | 1,233.8 | 1,341.4 | 1,436.9 | 1,421.6 | 1,684.1 | 1,819.9 | 1,896.4 | W | 1,821.4 |
| 2020's | 1,735.7 |
| - = No Data Reported; -- = Not Applicable; NA = Not Available; W = Withheld to avoid disclosure of individual company data. |
| Release Date: 6/1/2022 |
| Next Release Date: TBD |