|
Download Data (XLS File) |
|
||||||||
|
||||||||
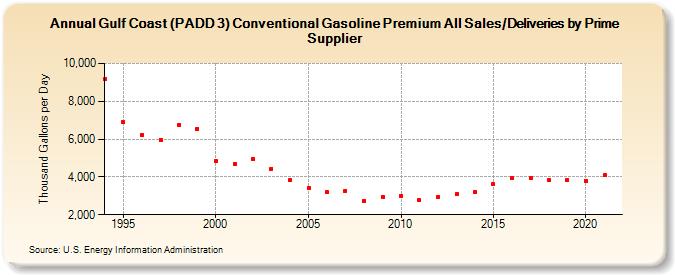
| Gulf Coast (PADD 3) Conventional Gasoline Premium All Sales/Deliveries by Prime Supplier (Thousand Gallons per Day) | ||||||||
| Decade | Year-0 | Year-1 | Year-2 | Year-3 | Year-4 | Year-5 | Year-6 | Year-7 | Year-8 | Year-9 |
|---|---|---|---|---|---|---|---|---|---|---|
| 1990's | 9,153.2 | 6,906.0 | 6,229.0 | 5,977.7 | 6,760.4 | 6,554.1 | ||||
| 2000's | 4,837.3 | 4,704.5 | 4,958.0 | 4,435.3 | 3,845.0 | 3,434.5 | 3,184.7 | 3,273.9 | 2,742.2 | 2,933.6 |
| 2010's | 3,013.4 | 2,759.3 | 2,939.6 | 3,094.5 | 3,198.3 | 3,621.9 | 3,921.3 | 3,921.6 | 3,845.6 | 3,834.6 |
| 2020's | 3,789.1 |
| - = No Data Reported; -- = Not Applicable; NA = Not Available; W = Withheld to avoid disclosure of individual company data. |
| Release Date: 6/1/2022 |
| Next Release Date: TBD |