|
Download Data (XLS File) |
|
||||||||
|
||||||||
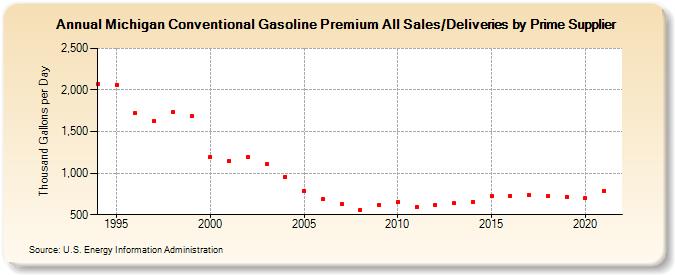
| Michigan Conventional Gasoline Premium All Sales/Deliveries by Prime Supplier (Thousand Gallons per Day) | ||||||||
| Decade | Year-0 | Year-1 | Year-2 | Year-3 | Year-4 | Year-5 | Year-6 | Year-7 | Year-8 | Year-9 |
|---|---|---|---|---|---|---|---|---|---|---|
| 1990's | 2,070.4 | 2,064.8 | 1,721.4 | 1,629.1 | 1,733.6 | 1,684.5 | ||||
| 2000's | 1,195.1 | 1,145.2 | 1,199.5 | 1,104.7 | 955.0 | 785.6 | 685.6 | 630.5 | 557.2 | 617.6 |
| 2010's | 653.6 | 594.0 | 617.2 | 635.8 | 656.8 | 724.1 | 729.0 | 736.2 | 720.9 | 717.6 |
| 2020's | 702.0 |
| - = No Data Reported; -- = Not Applicable; NA = Not Available; W = Withheld to avoid disclosure of individual company data. |
| Release Date: 6/1/2022 |
| Next Release Date: TBD |