|
Download Data (XLS File) |
|
||||||||
|
||||||||
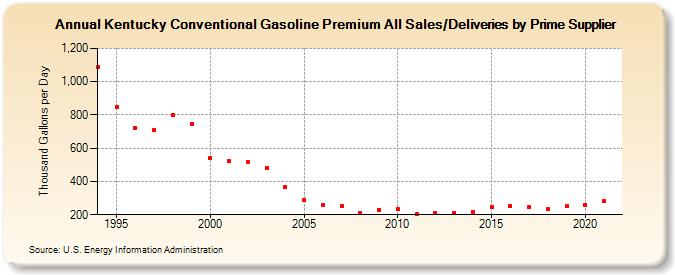
| Kentucky Conventional Gasoline Premium All Sales/Deliveries by Prime Supplier (Thousand Gallons per Day) | ||||||||
| Decade | Year-0 | Year-1 | Year-2 | Year-3 | Year-4 | Year-5 | Year-6 | Year-7 | Year-8 | Year-9 |
|---|---|---|---|---|---|---|---|---|---|---|
| 1990's | 1,089.0 | 846.5 | 722.8 | 709.8 | 801.4 | 743.5 | ||||
| 2000's | 541.5 | 523.3 | 518.2 | 483.1 | 369.2 | 288.9 | 255.6 | 253.7 | 208.3 | 228.8 |
| 2010's | 232.0 | 203.4 | 208.8 | 210.9 | 215.6 | 243.8 | 251.1 | 244.2 | 233.8 | 250.6 |
| 2020's | 260.1 |
| - = No Data Reported; -- = Not Applicable; NA = Not Available; W = Withheld to avoid disclosure of individual company data. |
| Release Date: 6/1/2022 |
| Next Release Date: TBD |