|
Download Data (XLS File) |
|
||||||||
|
||||||||
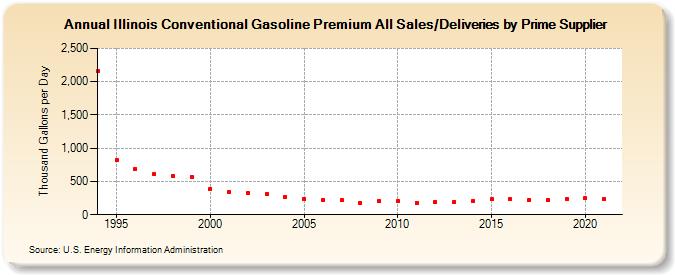
| Illinois Conventional Gasoline Premium All Sales/Deliveries by Prime Supplier (Thousand Gallons per Day) | ||||||||
| Decade | Year-0 | Year-1 | Year-2 | Year-3 | Year-4 | Year-5 | Year-6 | Year-7 | Year-8 | Year-9 |
|---|---|---|---|---|---|---|---|---|---|---|
| 1990's | 2,154.8 | 817.1 | 688.8 | 605.3 | 583.8 | 572.5 | ||||
| 2000's | 393.3 | 342.5 | 329.5 | 309.6 | 269.1 | 231.4 | 224.7 | 221.5 | 175.2 | 201.8 |
| 2010's | 202.7 | 181.0 | 196.7 | 198.0 | 206.3 | 231.7 | 229.5 | 221.5 | 224.6 | 236.8 |
| 2020's | 249.6 |
| - = No Data Reported; -- = Not Applicable; NA = Not Available; W = Withheld to avoid disclosure of individual company data. |
| Release Date: 6/1/2022 |
| Next Release Date: TBD |