|
Download Data (XLS File) |
|
||||||||
|
||||||||
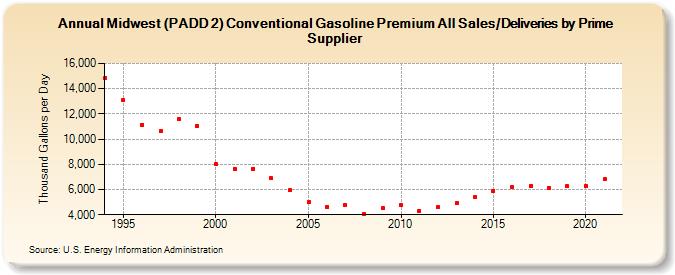
| Midwest (PADD 2) Conventional Gasoline Premium All Sales/Deliveries by Prime Supplier (Thousand Gallons per Day) | ||||||||
| Decade | Year-0 | Year-1 | Year-2 | Year-3 | Year-4 | Year-5 | Year-6 | Year-7 | Year-8 | Year-9 |
|---|---|---|---|---|---|---|---|---|---|---|
| 1990's | 14,855.3 | 13,066.5 | 11,154.7 | 10,611.5 | 11,613.8 | 11,064.9 | ||||
| 2000's | 7,998.0 | 7,629.8 | 7,659.7 | 6,874.4 | 5,954.3 | 5,001.8 | 4,642.1 | 4,732.6 | 4,063.2 | 4,507.7 |
| 2010's | 4,760.4 | 4,318.2 | 4,592.7 | 4,892.6 | 5,376.8 | 5,921.1 | 6,192.9 | 6,259.7 | 6,140.3 | 6,272.4 |
| 2020's | 6,314.8 |
| - = No Data Reported; -- = Not Applicable; NA = Not Available; W = Withheld to avoid disclosure of individual company data. |
| Release Date: 6/1/2022 |
| Next Release Date: TBD |