|
Download Data (XLS File) |
|
||||||||
|
||||||||
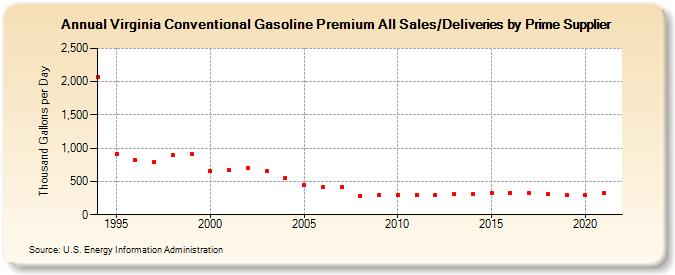
| Virginia Conventional Gasoline Premium All Sales/Deliveries by Prime Supplier (Thousand Gallons per Day) | ||||||||
| Decade | Year-0 | Year-1 | Year-2 | Year-3 | Year-4 | Year-5 | Year-6 | Year-7 | Year-8 | Year-9 |
|---|---|---|---|---|---|---|---|---|---|---|
| 1990's | 2,070.8 | 916.3 | 816.2 | 791.8 | 900.8 | 914.6 | ||||
| 2000's | 659.7 | 665.2 | 702.0 | 650.6 | 557.1 | 449.5 | 421.2 | 420.4 | 284.9 | 296.9 |
| 2010's | 301.9 | 303.7 | 300.9 | 312.2 | 308.9 | 327.2 | 333.4 | 325.2 | 305.9 | 299.5 |
| 2020's | 298.5 |
| - = No Data Reported; -- = Not Applicable; NA = Not Available; W = Withheld to avoid disclosure of individual company data. |
| Release Date: 6/1/2022 |
| Next Release Date: TBD |