|
Download Data (XLS File) |
|
||||||||
|
||||||||
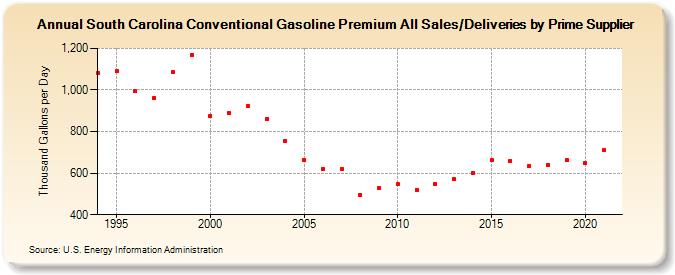
| South Carolina Conventional Gasoline Premium All Sales/Deliveries by Prime Supplier (Thousand Gallons per Day) | ||||||||
| Decade | Year-0 | Year-1 | Year-2 | Year-3 | Year-4 | Year-5 | Year-6 | Year-7 | Year-8 | Year-9 |
|---|---|---|---|---|---|---|---|---|---|---|
| 1990's | 1,082.8 | 1,089.9 | 992.7 | 962.8 | 1,085.5 | 1,169.1 | ||||
| 2000's | 876.3 | 887.6 | 924.6 | 860.6 | 756.4 | 664.2 | 617.6 | 622.2 | 493.8 | 528.8 |
| 2010's | 546.1 | 520.6 | 547.8 | 570.6 | 600.8 | 661.2 | 658.7 | 634.2 | 638.0 | 662.5 |
| 2020's | 649.8 |
| - = No Data Reported; -- = Not Applicable; NA = Not Available; W = Withheld to avoid disclosure of individual company data. |
| Release Date: 6/1/2022 |
| Next Release Date: TBD |