|
Download Data (XLS File) |
|
||||||||
|
||||||||
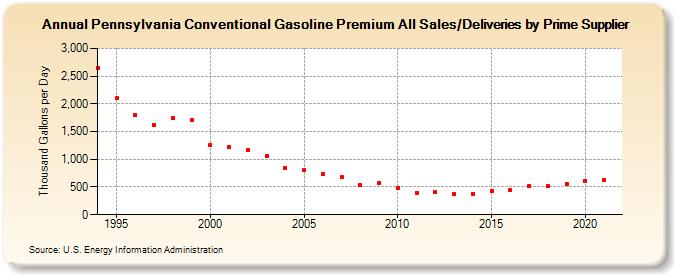
| Pennsylvania Conventional Gasoline Premium All Sales/Deliveries by Prime Supplier (Thousand Gallons per Day) | ||||||||
| Decade | Year-0 | Year-1 | Year-2 | Year-3 | Year-4 | Year-5 | Year-6 | Year-7 | Year-8 | Year-9 |
|---|---|---|---|---|---|---|---|---|---|---|
| 1990's | 2,655.3 | 2,098.0 | 1,800.9 | 1,615.0 | 1,748.0 | 1,701.9 | ||||
| 2000's | 1,264.2 | 1,229.8 | 1,173.6 | 1,065.7 | 850.1 | 802.4 | 735.0 | 676.6 | 529.9 | 574.2 |
| 2010's | 486.0 | 391.9 | 403.9 | 370.1 | 381.5 | 431.0 | 443.0 | 515.4 | 519.4 | 560.2 |
| 2020's | 609.2 |
| - = No Data Reported; -- = Not Applicable; NA = Not Available; W = Withheld to avoid disclosure of individual company data. |
| Release Date: 6/1/2022 |
| Next Release Date: TBD |