|
Download Data (XLS File) |
|
||||||||
|
||||||||
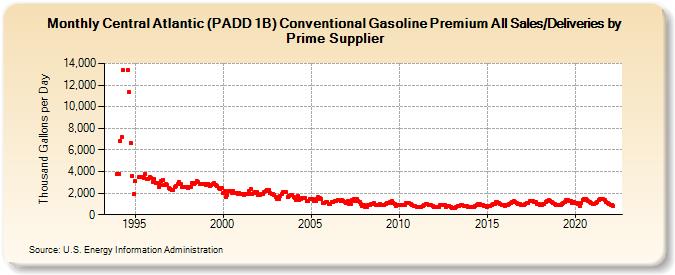
| Central Atlantic (PADD 1B) Conventional Gasoline Premium All Sales/Deliveries by Prime Supplier (Thousand Gallons per Day) | ||||||||
| Year | Jan | Feb | Mar | Apr | May | Jun | Jul | Aug | Sep | Oct | Nov | Dec |
|---|---|---|---|---|---|---|---|---|---|---|---|---|
| 1993 | NA | NA | NA | |||||||||
| 1994 | 3,791.0 | 3,801.8 | 6,827.7 | 7,208.2 | 13,356.3 | W | W | 13,390.0 | 11,353.4 | 6,609.5 | 3,594.9 | 1,872.6 |
| 1995 | 3,088.2 | W | W | 3,445.9 | 3,453.1 | 3,462.1 | 3,425.0 | 3,756.8 | 3,341.3 | 3,345.2 | 3,478.1 | 3,376.8 |
| 1996 | 3,044.0 | 3,287.4 | 2,956.9 | 2,941.4 | 2,605.8 | 2,733.7 | 3,118.9 | 3,216.6 | 2,757.1 | 2,828.1 | 2,735.5 | 2,518.5 |
| 1997 | 2,394.0 | 2,309.8 | 2,296.4 | 2,564.4 | 2,685.4 | 2,839.3 | 3,039.8 | 2,867.1 | 2,564.6 | 2,538.1 | 2,529.8 | 2,574.2 |
| 1998 | 2,463.4 | 2,604.7 | 2,609.2 | 2,928.3 | 2,805.0 | 2,956.0 | 3,122.7 | 2,999.8 | 2,839.9 | 2,834.7 | 2,841.6 | 2,853.7 |
| 1999 | 2,713.8 | 2,876.4 | 2,847.4 | 2,671.0 | 2,722.8 | 2,839.0 | 2,934.4 | 2,712.9 | 2,620.5 | 2,445.5 | 2,399.8 | 2,464.2 |
| 2000 | 2,034.5 | 2,240.7 | 1,638.3 | 1,838.2 | 2,174.3 | 2,166.9 | 2,024.8 | 2,193.7 | 2,010.0 | 2,032.7 | 1,951.2 | 2,007.6 |
| 2001 | 1,884.0 | 1,895.1 | 1,871.1 | 1,927.4 | 1,910.3 | 1,960.8 | 2,153.2 | 2,348.0 | 1,933.0 | 2,041.2 | 2,139.0 | 2,094.4 |
| 2002 | 1,789.2 | 1,853.6 | 1,917.4 | 1,885.1 | 2,084.1 | 2,171.7 | 2,323.3 | 2,272.5 | 2,023.1 | 1,908.7 | 1,902.6 | 1,864.7 |
| 2003 | 1,666.5 | 1,432.9 | 1,465.0 | 1,775.9 | 1,888.4 | 2,066.1 | 2,148.2 | 2,072.5 | 1,651.8 | 1,711.9 | 1,779.7 | 1,802.1 |
| 2004 | 1,599.0 | 1,516.7 | 1,376.0 | 1,754.3 | 1,330.0 | 1,434.2 | 1,566.4 | 1,523.4 | 1,539.4 | 1,279.3 | 1,254.9 | 1,465.9 |
| 2005 | 1,434.4 | 1,436.3 | 1,312.6 | 1,298.3 | 1,456.1 | 1,608.6 | 1,504.9 | 1,415.7 | 1,130.3 | 1,095.1 | 1,152.6 | 1,207.0 |
| 2006 | 971.7 | 1,033.8 | 1,193.2 | 1,153.7 | 1,257.3 | 1,274.6 | 1,367.8 | 1,400.8 | 1,233.4 | 1,319.7 | 1,303.6 | 1,161.2 |
| 2007 | 1,063.2 | 1,255.5 | 1,021.0 | 1,024.9 | 1,344.8 | 1,433.6 | 1,264.6 | 1,409.0 | 1,239.5 | 1,147.4 | 949.5 | 850.9 |
| 2008 | 874.9 | 744.3 | 721.7 | 908.2 | 930.6 | 966.4 | 990.0 | 1,077.7 | 883.1 | 926.9 | 906.2 | 972.0 |
| 2009 | 905.4 | 909.1 | 914.7 | 994.5 | 1,114.8 | 1,088.6 | 1,185.0 | 1,268.8 | 1,064.8 | 1,024.4 | 838.1 | 896.1 |
| 2010 | 884.9 | 885.3 | 859.0 | 944.2 | 942.3 | 1,065.2 | 1,112.6 | 1,054.8 | 1,021.3 | 877.8 | 815.0 | 825.7 |
| 2011 | 717.8 | 717.7 | 707.4 | 699.9 | 822.1 | 895.0 | 974.0 | 962.7 | 882.5 | 902.0 | 854.1 | 797.5 |
| 2012 | 680.0 | 749.3 | 723.4 | 733.0 | 855.0 | 927.3 | 934.0 | 910.9 | 734.7 | 767.5 | 821.5 | 707.3 |
| 2013 | 654.6 | 637.4 | 638.0 | 756.9 | 835.4 | 832.3 | 871.7 | 914.2 | 844.3 | 831.5 | 800.5 | 748.8 |
| 2014 | 707.6 | 735.4 | 733.8 | 743.5 | 826.6 | 876.6 | 978.1 | 953.3 | 871.9 | 873.0 | 799.5 | 805.8 |
| 2015 | 747.2 | 837.8 | 789.4 | 906.0 | 956.9 | 963.7 | 1,176.7 | 1,157.2 | 1,056.8 | 980.7 | 915.1 | 880.5 |
| 2016 | 826.7 | 887.8 | 912.5 | 999.2 | 1,074.9 | 1,191.1 | 1,225.6 | 1,191.0 | 1,104.3 | 986.2 | 965.6 | 938.5 |
| 2017 | 855.1 | 934.3 | 959.0 | 1,043.4 | 1,051.6 | 1,245.0 | 1,279.4 | 1,294.8 | 1,192.7 | 1,132.0 | 1,033.4 | 962.5 |
| 2018 | 911.8 | 917.9 | 1,035.1 | 971.3 | 1,202.5 | 1,243.1 | 1,328.5 | 1,311.6 | 1,150.0 | 1,058.1 | 995.4 | 939.2 |
| 2019 | 914.5 | 922.9 | 942.7 | 970.2 | 1,100.8 | 1,206.5 | 1,324.0 | 1,393.6 | 1,313.6 | 1,250.1 | 1,123.4 | 1,165.7 |
| 2020 | 1,072.5 | 1,130.6 | 995.5 | 761.3 | 1,067.3 | 1,400.7 | 1,463.5 | 1,446.4 | 1,354.6 | 1,254.7 | 1,137.9 | 1,040.3 |
| 2021 | 994.9 | 1,016.6 | 1,040.6 | 1,171.2 | 1,343.5 | 1,422.9 | 1,446.5 | 1,443.7 | 1,349.3 | 1,152.9 | 1,050.1 | 1,011.8 |
| 2022 | 894.0 | 941.1 | 814.0 | |||||||||
| - = No Data Reported; -- = Not Applicable; NA = Not Available; W = Withheld to avoid disclosure of individual company data. |
| Release Date: 5/19/2022 |
| Next Release Date: TBD |