|
Download Data (XLS File) |
|
||||||||
|
||||||||
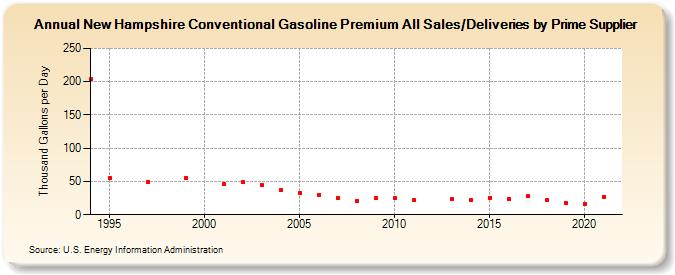
| New Hampshire Conventional Gasoline Premium All Sales/Deliveries by Prime Supplier (Thousand Gallons per Day) | ||||||||
| Decade | Year-0 | Year-1 | Year-2 | Year-3 | Year-4 | Year-5 | Year-6 | Year-7 | Year-8 | Year-9 |
|---|---|---|---|---|---|---|---|---|---|---|
| 1990's | 203.8 | 54.5 | W | 49.7 | W | 55.7 | ||||
| 2000's | W | 45.8 | 49.1 | 44.6 | 37.3 | 32.1 | 30.0 | 25.6 | 20.4 | 25.0 |
| 2010's | 25.4 | 21.6 | W | 23.0 | 22.2 | 25.5 | 24.3 | 27.7 | 21.6 | 17.4 |
| 2020's | 16.8 |
| - = No Data Reported; -- = Not Applicable; NA = Not Available; W = Withheld to avoid disclosure of individual company data. |
| Release Date: 6/1/2022 |
| Next Release Date: TBD |