|
Download Data (XLS File) |
|
||||||||
|
||||||||
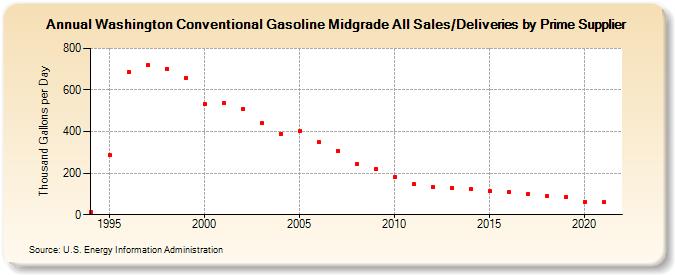
| Washington Conventional Gasoline Midgrade All Sales/Deliveries by Prime Supplier (Thousand Gallons per Day) | ||||||||
| Decade | Year-0 | Year-1 | Year-2 | Year-3 | Year-4 | Year-5 | Year-6 | Year-7 | Year-8 | Year-9 |
|---|---|---|---|---|---|---|---|---|---|---|
| 1990's | 12.2 | 285.5 | 686.6 | 718.0 | 702.7 | 659.7 | ||||
| 2000's | 530.8 | 536.8 | 510.6 | 440.4 | 390.3 | 400.7 | 348.6 | 308.1 | 242.4 | 221.3 |
| 2010's | 179.3 | 145.6 | 132.7 | 128.4 | 122.6 | 112.4 | 108.6 | 100.4 | 88.6 | 84.0 |
| 2020's | 63.3 |
| - = No Data Reported; -- = Not Applicable; NA = Not Available; W = Withheld to avoid disclosure of individual company data. |
| Release Date: 6/1/2022 |
| Next Release Date: TBD |