|
Download Data (XLS File) |
|
||||||||
|
||||||||
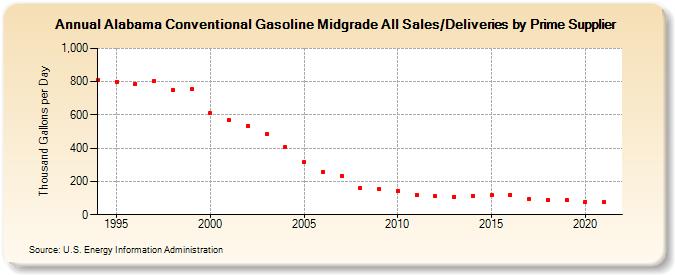
| Alabama Conventional Gasoline Midgrade All Sales/Deliveries by Prime Supplier (Thousand Gallons per Day) | ||||||||
| Decade | Year-0 | Year-1 | Year-2 | Year-3 | Year-4 | Year-5 | Year-6 | Year-7 | Year-8 | Year-9 |
|---|---|---|---|---|---|---|---|---|---|---|
| 1990's | 812.7 | 799.7 | 785.5 | 803.3 | 749.5 | 755.2 | ||||
| 2000's | 608.6 | 567.5 | 535.3 | 482.6 | 407.3 | 317.6 | 258.4 | 235.3 | 161.9 | 152.3 |
| 2010's | 144.2 | 119.4 | 110.7 | 108.3 | 114.2 | 115.6 | 120.3 | 94.5 | 91.0 | 88.7 |
| 2020's | 79.2 |
| - = No Data Reported; -- = Not Applicable; NA = Not Available; W = Withheld to avoid disclosure of individual company data. |
| Release Date: 6/1/2022 |
| Next Release Date: TBD |