|
Download Data (XLS File) |
|
||||||||
|
||||||||
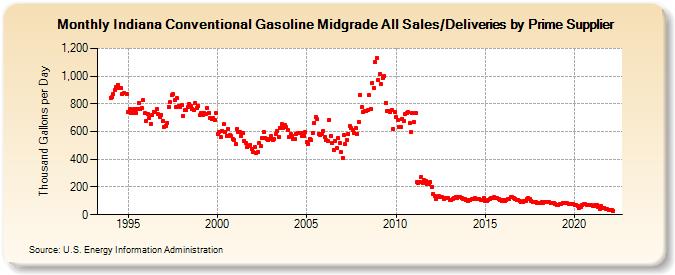
| Indiana Conventional Gasoline Midgrade All Sales/Deliveries by Prime Supplier (Thousand Gallons per Day) | ||||||||
| Year | Jan | Feb | Mar | Apr | May | Jun | Jul | Aug | Sep | Oct | Nov | Dec |
|---|---|---|---|---|---|---|---|---|---|---|---|---|
| 1993 | NA | NA | NA | |||||||||
| 1994 | 844.5 | 846.1 | 869.5 | 899.9 | 920.4 | 937.5 | 914.2 | 914.7 | 870.0 | 874.9 | W | 867.9 |
| 1995 | 744.4 | 762.1 | 731.6 | 734.0 | 762.5 | 734.1 | 761.1 | 807.9 | 761.8 | 766.6 | 824.9 | 731.6 |
| 1996 | 676.4 | 727.1 | 694.2 | 657.1 | 717.4 | 744.2 | 743.8 | 763.1 | 724.6 | 708.0 | 721.1 | 676.5 |
| 1997 | 633.8 | 643.1 | 663.4 | 779.6 | 809.9 | 863.7 | 868.5 | 826.6 | 777.9 | 839.8 | 787.7 | 779.4 |
| 1998 | 788.2 | 713.6 | 753.2 | 755.8 | 777.2 | 801.8 | 786.5 | 764.7 | 757.2 | 806.3 | 772.0 | 783.6 |
| 1999 | 719.4 | 733.1 | 719.8 | 735.1 | 728.2 | 771.9 | 735.7 | 694.9 | 687.5 | 698.8 | 679.8 | 730.4 |
| 2000 | 583.1 | 596.6 | 559.4 | 606.4 | 654.3 | 593.7 | 569.0 | 616.7 | 572.9 | 564.7 | 546.5 | 542.5 |
| 2001 | 510.7 | 617.9 | 599.4 | 598.6 | 568.3 | 592.7 | 530.5 | 519.5 | 486.1 | 494.8 | 504.1 | 476.5 |
| 2002 | 453.6 | 490.8 | 441.7 | 450.8 | 517.2 | 495.4 | 552.7 | 598.1 | 554.2 | 548.4 | 537.2 | 549.5 |
| 2003 | 568.8 | 540.4 | 546.2 | 579.0 | 606.0 | 563.0 | 628.8 | 651.2 | 626.8 | 644.7 | 629.4 | 610.0 |
| 2004 | 562.6 | 581.2 | 570.9 | 547.4 | 549.5 | 581.7 | 592.5 | 591.5 | 591.5 | 568.2 | 568.3 | 593.9 |
| 2005 | 525.5 | 511.0 | 549.5 | 536.8 | 586.8 | 662.7 | 705.6 | 688.7 | 581.5 | 576.7 | 579.4 | 605.8 |
| 2006 | 558.9 | 540.1 | 528.5 | 685.5 | 566.9 | 518.3 | 465.1 | 528.5 | 480.5 | 554.5 | 517.5 | 449.5 |
| 2007 | 411.9 | 574.4 | 507.8 | 541.1 | 580.7 | 637.5 | 624.1 | 611.7 | 593.0 | 623.8 | 584.3 | 669.0 |
| 2008 | 866.0 | 778.4 | 738.9 | 750.1 | 749.8 | 753.0 | 861.6 | 765.7 | 950.6 | 917.0 | 1,101.0 | 1,133.0 |
| 2009 | 975.3 | 1,016.5 | 940.7 | 986.0 | 997.2 | 808.1 | 750.7 | 745.5 | 742.3 | 755.9 | 619.1 | 741.4 |
| 2010 | 707.8 | 683.0 | 636.4 | 635.7 | 692.3 | 678.9 | 724.5 | 736.9 | 739.8 | 658.9 | 594.5 | 734.0 |
| 2011 | 670.3 | 737.0 | 235.1 | 227.3 | 239.3 | 270.5 | 228.5 | 248.7 | 246.4 | 221.1 | 222.9 | 236.0 |
| 2012 | 199.9 | 150.5 | 132.4 | 116.0 | 130.5 | 133.2 | 127.5 | 126.3 | 116.6 | 122.6 | 118.9 | 120.4 |
| 2013 | 109.0 | 107.4 | 114.6 | 118.0 | 126.2 | 118.9 | 127.5 | 125.3 | 119.3 | 113.1 | 115.1 | 106.5 |
| 2014 | 101.1 | 104.7 | 104.6 | 111.2 | 114.5 | 119.1 | 114.3 | 115.7 | 114.3 | 106.6 | 109.0 | 119.6 |
| 2015 | 100.3 | 99.3 | 107.4 | 113.2 | 121.9 | 122.7 | 127.6 | 121.6 | 118.7 | 112.1 | 106.1 | 101.2 |
| 2016 | 109.6 | 101.1 | 104.3 | 112.2 | 116.4 | 126.0 | 124.6 | 121.5 | 115.8 | 108.0 | 107.2 | 99.8 |
| 2017 | 91.5 | 90.0 | 99.2 | 100.2 | 111.3 | 121.2 | 113.3 | 100.9 | 94.4 | 91.9 | 90.0 | 87.5 |
| 2018 | 82.1 | 85.2 | 88.3 | 87.5 | 95.1 | 94.5 | 89.5 | 90.4 | 85.3 | 83.2 | 84.5 | 78.2 |
| 2019 | 71.0 | 73.5 | 78.5 | 78.0 | 84.7 | 82.2 | 82.7 | 81.2 | 75.6 | 80.6 | 75.9 | 76.0 |
| 2020 | 71.8 | 72.1 | 63.6 | 48.2 | 57.6 | 72.8 | 74.9 | 73.9 | 72.6 | 71.7 | 69.0 | 66.7 |
| 2021 | 66.0 | 65.3 | 70.0 | 73.2 | 53.6 | 38.5 | 59.5 | 50.6 | 50.3 | 42.8 | 40.6 | 36.6 |
| 2022 | 35.8 | 37.2 | 29.2 | |||||||||
| - = No Data Reported; -- = Not Applicable; NA = Not Available; W = Withheld to avoid disclosure of individual company data. |
| Release Date: 5/19/2022 |
| Next Release Date: TBD |