|
Download Data (XLS File) |
|
||||||||
|
||||||||
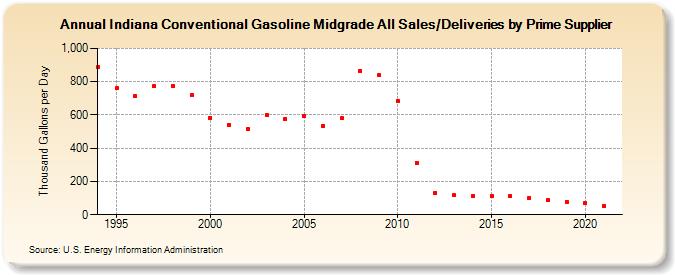
| Indiana Conventional Gasoline Midgrade All Sales/Deliveries by Prime Supplier (Thousand Gallons per Day) | ||||||||
| Decade | Year-0 | Year-1 | Year-2 | Year-3 | Year-4 | Year-5 | Year-6 | Year-7 | Year-8 | Year-9 |
|---|---|---|---|---|---|---|---|---|---|---|
| 1990's | 886.9 | 760.2 | 712.7 | 773.5 | 772.1 | 719.4 | ||||
| 2000's | 583.8 | 540.9 | 516.1 | 600.0 | 574.9 | 593.2 | 532.6 | 579.9 | 864.0 | 839.0 |
| 2010's | 685.5 | 312.6 | 132.9 | 116.8 | 111.3 | 112.8 | 112.2 | 99.3 | 87.0 | 78.4 |
| 2020's | 67.9 |
| - = No Data Reported; -- = Not Applicable; NA = Not Available; W = Withheld to avoid disclosure of individual company data. |
| Release Date: 6/1/2022 |
| Next Release Date: TBD |