|
Download Data (XLS File) |
|
||||||||
|
||||||||
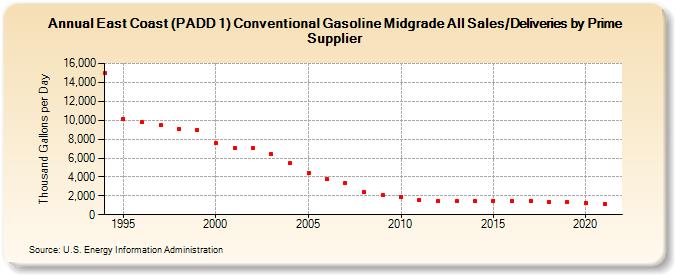
| East Coast (PADD 1) Conventional Gasoline Midgrade All Sales/Deliveries by Prime Supplier (Thousand Gallons per Day) | ||||||||
| Decade | Year-0 | Year-1 | Year-2 | Year-3 | Year-4 | Year-5 | Year-6 | Year-7 | Year-8 | Year-9 |
|---|---|---|---|---|---|---|---|---|---|---|
| 1990's | 14,945.7 | 10,120.5 | 9,784.4 | 9,450.4 | 9,084.0 | 8,986.1 | ||||
| 2000's | 7,542.0 | 7,044.4 | 7,028.4 | 6,401.5 | 5,442.3 | 4,413.1 | 3,731.9 | 3,330.8 | 2,362.5 | 2,053.4 |
| 2010's | 1,866.8 | 1,592.7 | 1,459.3 | 1,423.6 | 1,420.9 | 1,492.9 | 1,501.1 | 1,452.7 | 1,346.7 | 1,348.7 |
| 2020's | 1,247.2 |
| - = No Data Reported; -- = Not Applicable; NA = Not Available; W = Withheld to avoid disclosure of individual company data. |
| Release Date: 6/1/2022 |
| Next Release Date: TBD |