|
Download Data (XLS File) |
|
||||||||
|
||||||||
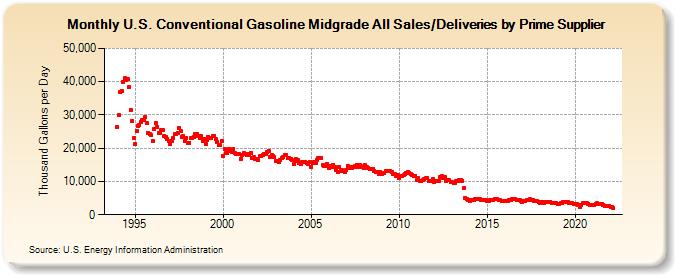
| U.S. Conventional Gasoline Midgrade All Sales/Deliveries by Prime Supplier (Thousand Gallons per Day) | ||||||||
| Year | Jan | Feb | Mar | Apr | May | Jun | Jul | Aug | Sep | Oct | Nov | Dec |
|---|---|---|---|---|---|---|---|---|---|---|---|---|
| 1993 | NA | NA | NA | |||||||||
| 1994 | 26,470.5 | 29,884.4 | 36,808.5 | 37,184.2 | 39,820.8 | 41,028.8 | 40,517.5 | 40,783.3 | 38,376.9 | 31,476.5 | 28,280.7 | 22,988.8 |
| 1995 | 21,325.8 | 25,038.0 | 26,758.2 | 27,004.8 | 27,876.2 | 28,544.1 | 28,345.2 | 29,389.8 | 27,443.2 | 24,675.6 | 24,264.4 | 23,870.9 |
| 1996 | 22,186.7 | 25,891.2 | 27,541.1 | 26,368.4 | 24,576.4 | 24,566.8 | 25,495.0 | 25,360.2 | 23,704.3 | 23,413.8 | 22,727.4 | 22,277.0 |
| 1997 | 21,260.7 | 22,197.4 | 23,091.5 | 24,144.7 | 24,330.4 | 24,625.0 | 26,160.7 | 25,073.6 | 23,481.6 | 23,714.2 | 22,148.7 | 23,064.0 |
| 1998 | 21,437.8 | 21,643.8 | 22,934.3 | 23,130.1 | 23,375.0 | 24,193.9 | 24,363.6 | 23,798.8 | 23,034.6 | 23,595.5 | 22,268.8 | 22,897.6 |
| 1999 | 21,109.7 | 22,564.3 | 23,380.4 | 23,176.8 | 23,132.0 | 23,655.7 | 23,780.4 | 22,820.0 | 21,822.9 | 21,069.4 | 20,869.6 | 22,223.3 |
| 2000 | 17,670.2 | 19,814.7 | 18,683.5 | 18,586.7 | 19,801.8 | 19,221.5 | 18,915.4 | 19,815.8 | 18,445.2 | 18,124.2 | 18,107.4 | 18,322.5 |
| 2001 | 16,699.1 | 17,936.4 | 18,499.9 | 18,291.7 | 17,928.5 | 18,322.7 | 18,077.0 | 18,553.3 | 16,965.5 | 17,281.8 | 16,731.4 | 16,715.7 |
| 2002 | 16,445.7 | 17,600.5 | 17,635.6 | 17,923.2 | 18,267.3 | 18,273.1 | 18,822.2 | 19,229.0 | 17,464.9 | 17,868.2 | 17,582.5 | 17,319.1 |
| 2003 | 16,288.0 | 16,103.3 | 15,902.0 | 16,538.1 | 17,110.5 | 17,401.0 | 17,995.9 | 17,908.4 | 16,996.3 | 17,150.3 | 16,786.1 | 16,442.8 |
| 2004 | 15,280.2 | 16,064.0 | 16,668.7 | 16,407.4 | 15,463.4 | 15,276.3 | 15,854.7 | 15,970.9 | 15,896.8 | 15,411.4 | 15,202.1 | 15,926.3 |
| 2005 | 14,481.5 | 15,420.3 | 15,781.8 | 15,655.2 | 16,527.2 | 17,198.7 | 17,167.2 | 17,102.3 | 14,890.1 | 14,559.5 | 14,737.8 | 15,250.5 |
| 2006 | 14,040.0 | 14,759.6 | 14,471.5 | 15,056.0 | 14,297.4 | 13,474.6 | 12,711.8 | 14,388.1 | 13,175.3 | 13,367.8 | 13,158.4 | 12,959.0 |
| 2007 | 13,426.8 | 14,707.8 | 14,013.9 | 14,223.8 | 14,045.2 | 14,421.4 | 14,557.4 | 15,069.5 | 14,261.8 | 14,939.9 | 14,505.8 | 14,288.7 |
| 2008 | 14,167.1 | 14,919.2 | 14,248.6 | 14,115.2 | 13,789.2 | 13,663.4 | 13,686.5 | 13,223.7 | 12,972.5 | 12,887.2 | 12,310.2 | 12,777.7 |
| 2009 | 12,103.1 | 12,634.4 | 12,412.3 | 13,123.0 | 13,185.0 | 13,165.2 | 13,087.4 | 12,820.0 | 12,378.5 | 12,095.5 | 11,615.8 | 11,846.7 |
| 2010 | 10,921.7 | 11,701.3 | 11,544.4 | 11,903.6 | 12,099.5 | 12,684.8 | 12,901.7 | 12,559.2 | 12,142.8 | 11,838.4 | 11,634.0 | 11,719.3 |
| 2011 | 10,439.9 | 10,902.9 | 10,265.5 | 10,156.7 | 10,318.3 | 10,807.9 | 10,904.5 | 11,046.4 | 10,211.9 | 10,199.5 | 10,243.6 | 10,772.4 |
| 2012 | 9,820.8 | 10,174.3 | 10,213.8 | 10,273.9 | 11,485.1 | 11,499.9 | 11,099.2 | 11,204.6 | 10,079.6 | 10,505.1 | 10,377.9 | 9,842.4 |
| 2013 | 9,705.2 | 9,591.8 | 9,630.4 | 10,115.5 | 10,162.1 | 10,307.1 | 10,566.4 | 10,270.0 | 8,017.2 | 5,145.5 | 4,726.9 | 4,539.5 |
| 2014 | 4,148.6 | 4,287.8 | 4,424.0 | 4,535.0 | 4,751.8 | 4,605.4 | 4,702.2 | 4,603.8 | 4,351.9 | 4,433.5 | 4,364.4 | 4,317.5 |
| 2015 | 4,032.9 | 4,131.4 | 4,305.1 | 4,453.1 | 4,542.4 | 4,676.7 | 4,818.2 | 4,600.5 | 4,436.6 | 4,367.3 | 4,245.0 | 4,214.4 |
| 2016 | 4,022.1 | 4,126.1 | 4,220.5 | 4,325.3 | 4,405.4 | 4,640.1 | 4,692.3 | 4,582.1 | 4,324.7 | 4,431.4 | 4,319.3 | 4,271.2 |
| 2017 | 3,838.5 | 4,004.5 | 4,198.4 | 4,289.9 | 4,463.8 | 4,599.2 | 4,541.9 | 4,509.1 | 4,020.8 | 4,050.7 | 3,975.7 | 3,902.0 |
| 2018 | 3,538.5 | 3,730.4 | 3,724.8 | 3,662.9 | 3,869.1 | 3,965.8 | 3,914.3 | 3,969.8 | 3,667.2 | 3,614.8 | 3,577.2 | 3,429.2 |
| 2019 | 3,242.9 | 3,335.9 | 3,515.8 | 3,566.6 | 3,784.5 | 3,765.3 | 3,883.0 | 3,892.6 | 3,555.3 | 3,540.8 | 3,417.6 | 3,332.9 |
| 2020 | 3,196.3 | 3,244.1 | 3,055.1 | 2,305.0 | 2,969.6 | 3,416.9 | 3,652.1 | 3,540.9 | 3,377.0 | 3,303.1 | 3,062.4 | 3,029.5 |
| 2021 | 2,866.7 | 2,928.0 | 3,182.0 | 3,422.3 | 3,198.5 | 3,120.5 | 3,159.7 | 3,032.6 | 2,767.6 | 2,670.8 | 2,607.2 | 2,563.3 |
| 2022 | 2,336.7 | 2,413.6 | 2,043.1 | |||||||||
| - = No Data Reported; -- = Not Applicable; NA = Not Available; W = Withheld to avoid disclosure of individual company data. |
| Release Date: 5/19/2022 |
| Next Release Date: TBD |