|
Download Data (XLS File) |
|
||||||||
|
||||||||
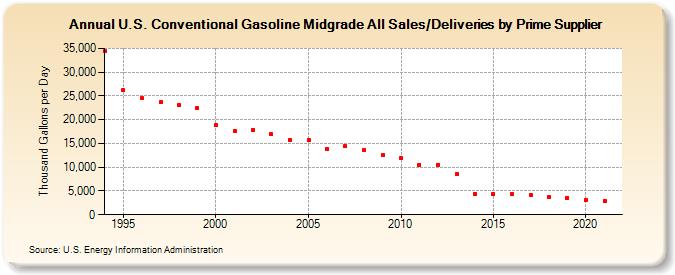
| U.S. Conventional Gasoline Midgrade All Sales/Deliveries by Prime Supplier (Thousand Gallons per Day) | ||||||||
| Decade | Year-0 | Year-1 | Year-2 | Year-3 | Year-4 | Year-5 | Year-6 | Year-7 | Year-8 | Year-9 |
|---|---|---|---|---|---|---|---|---|---|---|
| 1990's | 34,486.9 | 26,214.4 | 24,503.8 | 23,619.4 | 23,066.7 | 22,467.2 | ||||
| 2000's | 18,789.0 | 17,672.9 | 17,872.1 | 16,891.2 | 15,784.6 | 15,734.8 | 13,815.1 | 14,369.3 | 13,559.2 | 12,537.8 |
| 2010's | 11,971.8 | 10,521.2 | 10,550.0 | 8,559.4 | 4,461.9 | 4,403.6 | 4,364.2 | 4,200.9 | 3,722.0 | 3,571.3 |
| 2020's | 3,180.5 |
| - = No Data Reported; -- = Not Applicable; NA = Not Available; W = Withheld to avoid disclosure of individual company data. |
| Release Date: 6/1/2022 |
| Next Release Date: TBD |