|
Download Data (XLS File) |
|
||||||||
|
||||||||
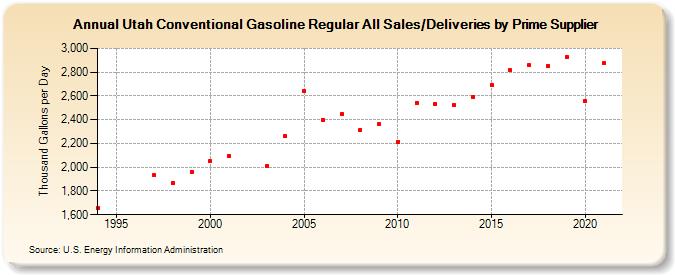
| Utah Conventional Gasoline Regular All Sales/Deliveries by Prime Supplier (Thousand Gallons per Day) | ||||||||
| Decade | Year-0 | Year-1 | Year-2 | Year-3 | Year-4 | Year-5 | Year-6 | Year-7 | Year-8 | Year-9 |
|---|---|---|---|---|---|---|---|---|---|---|
| 1990's | 1,657.3 | W | W | 1,931.1 | 1,868.1 | 1,961.9 | ||||
| 2000's | 2,050.1 | 2,095.4 | W | 2,007.9 | 2,262.1 | 2,642.6 | 2,398.0 | 2,451.7 | 2,314.0 | 2,360.7 |
| 2010's | 2,214.5 | 2,542.9 | 2,533.6 | 2,522.2 | 2,593.7 | 2,692.9 | 2,814.0 | 2,857.8 | 2,855.3 | 2,928.3 |
| 2020's | 2,553.5 |
| - = No Data Reported; -- = Not Applicable; NA = Not Available; W = Withheld to avoid disclosure of individual company data. |
| Release Date: 6/1/2022 |
| Next Release Date: TBD |