|
Download Data (XLS File) |
|
||||||||
|
||||||||
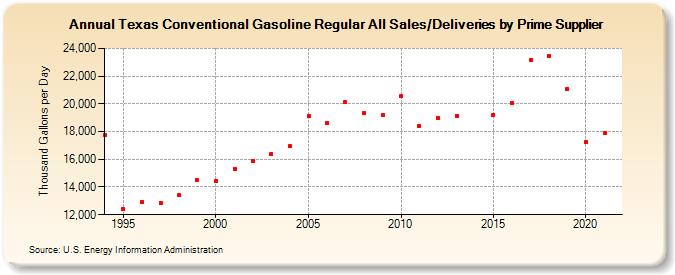
| Texas Conventional Gasoline Regular All Sales/Deliveries by Prime Supplier (Thousand Gallons per Day) | ||||||||
| Decade | Year-0 | Year-1 | Year-2 | Year-3 | Year-4 | Year-5 | Year-6 | Year-7 | Year-8 | Year-9 |
|---|---|---|---|---|---|---|---|---|---|---|
| 1990's | 17,774.7 | 12,407.4 | 12,922.5 | 12,864.3 | 13,411.4 | 14,502.4 | ||||
| 2000's | 14,463.5 | 15,297.4 | 15,895.9 | 16,362.5 | 16,958.3 | 19,117.5 | 18,632.7 | 20,100.2 | 19,335.2 | 19,158.3 |
| 2010's | 20,545.9 | 18,410.4 | 18,984.3 | 19,130.1 | W | 19,230.3 | 20,080.7 | 23,170.2 | 23,436.6 | 21,075.0 |
| 2020's | 17,262.7 |
| - = No Data Reported; -- = Not Applicable; NA = Not Available; W = Withheld to avoid disclosure of individual company data. |
| Release Date: 6/1/2022 |
| Next Release Date: TBD |