|
Download Data (XLS File) |
|
||||||||
|
||||||||
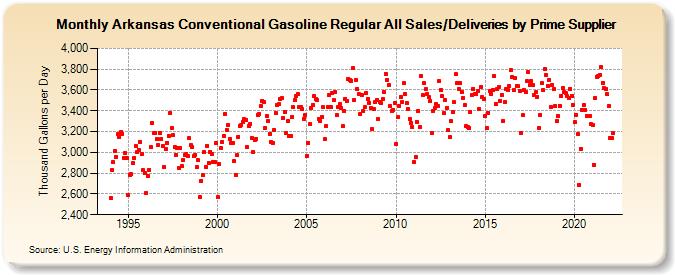
| Arkansas Conventional Gasoline Regular All Sales/Deliveries by Prime Supplier (Thousand Gallons per Day) | ||||||||
| Year | Jan | Feb | Mar | Apr | May | Jun | Jul | Aug | Sep | Oct | Nov | Dec |
|---|---|---|---|---|---|---|---|---|---|---|---|---|
| 1993 | NA | NA | NA | |||||||||
| 1994 | 2,564.0 | 2,831.2 | 2,903.4 | 3,010.9 | 2,957.9 | 3,172.4 | 3,144.2 | 3,200.0 | 3,178.3 | 2,946.5 | 2,991.3 | 2,942.4 |
| 1995 | 2,586.1 | 2,780.7 | 2,788.2 | 2,894.7 | 2,947.1 | 3,059.8 | 2,998.9 | 3,025.8 | 3,098.2 | 2,987.6 | 2,826.0 | 2,801.0 |
| 1996 | 2,608.0 | 2,776.5 | 2,833.3 | 3,049.9 | 3,281.7 | 3,184.6 | 3,185.0 | 3,129.1 | 3,070.2 | 3,187.2 | 3,126.0 | 3,064.8 |
| 1997 | 2,857.4 | 3,033.3 | 3,094.4 | 3,160.7 | 3,379.0 | 3,233.9 | 3,166.2 | 3,051.9 | 2,978.4 | 3,045.0 | 2,846.3 | 3,040.4 |
| 1998 | 2,865.3 | 2,929.2 | 2,976.3 | 2,980.7 | 2,967.2 | 3,134.6 | 3,066.4 | 3,055.5 | 2,965.9 | 2,975.9 | 2,854.9 | 2,922.4 |
| 1999 | 2,569.4 | 2,727.5 | 2,779.3 | 3,000.3 | 2,862.6 | 3,062.0 | 2,898.6 | 3,003.4 | 2,981.6 | 2,907.1 | 2,909.1 | 3,087.9 |
| 2000 | 2,567.4 | 2,887.7 | 3,043.4 | 3,098.7 | 3,155.0 | 3,369.0 | 3,217.9 | 3,260.1 | 3,127.8 | 3,089.6 | 3,094.2 | 2,913.6 |
| 2001 | 2,783.0 | 2,974.2 | 3,152.4 | 3,254.6 | 3,266.9 | 3,290.3 | 3,316.6 | 3,311.2 | 3,047.6 | 3,253.8 | 3,276.7 | 3,141.6 |
| 2002 | 3,002.2 | 3,121.0 | 3,132.4 | 3,363.9 | 3,370.3 | 3,443.0 | 3,497.2 | 3,486.6 | 3,237.5 | 3,351.9 | 3,305.8 | 3,179.3 |
| 2003 | 3,101.0 | 3,085.2 | 3,218.9 | 3,379.6 | 3,458.8 | 3,460.3 | 3,515.1 | 3,520.4 | 3,330.8 | 3,392.4 | 3,184.3 | 3,296.8 |
| 2004 | 3,155.4 | 3,161.0 | 3,337.1 | 3,432.0 | 3,502.9 | 3,538.4 | 3,563.2 | 3,435.0 | 3,433.9 | 3,415.7 | 3,325.5 | 3,356.6 |
| 2005 | 2,969.1 | 3,090.8 | 3,268.5 | 3,425.7 | 3,455.7 | 3,541.0 | 3,510.7 | 3,505.7 | 3,325.3 | 3,304.9 | 3,340.7 | 3,432.2 |
| 2006 | 3,125.5 | 3,251.4 | 3,438.4 | 3,549.8 | 3,433.0 | 3,567.4 | 3,499.4 | 3,580.9 | 3,356.5 | 3,435.2 | 3,465.3 | 3,431.2 |
| 2007 | 3,250.7 | 3,392.9 | 3,517.6 | 3,494.3 | 3,708.3 | 3,696.0 | 3,689.2 | 3,809.2 | 3,507.6 | 3,696.9 | 3,609.2 | 3,557.7 |
| 2008 | 3,367.1 | 3,550.5 | 3,394.7 | 3,432.5 | 3,574.3 | 3,516.8 | 3,478.2 | 3,429.5 | 3,225.9 | 3,414.9 | 3,483.3 | 3,503.7 |
| 2009 | 3,321.1 | 3,484.2 | 3,474.6 | 3,508.9 | 3,581.7 | 3,758.4 | 3,699.5 | 3,649.8 | 3,448.1 | 3,401.5 | 3,410.7 | 3,478.3 |
| 2010 | 3,084.3 | 3,336.6 | 3,450.2 | 3,533.7 | 3,480.2 | 3,663.2 | 3,562.9 | 3,476.5 | 3,415.4 | 3,322.9 | 3,281.1 | 3,240.5 |
| 2011 | 2,908.2 | 2,956.7 | 3,296.5 | 3,398.4 | 3,243.5 | 3,732.5 | 3,547.2 | 3,666.4 | 3,607.3 | 3,562.6 | 3,531.7 | 3,493.4 |
| 2012 | 3,182.7 | 3,396.9 | 3,428.4 | 3,462.7 | 3,446.9 | 3,685.4 | 3,601.1 | 3,537.3 | 3,373.9 | 3,501.6 | 3,428.1 | 3,214.3 |
| 2013 | 3,145.0 | 3,298.1 | 3,383.6 | 3,480.6 | 3,750.7 | 3,662.9 | 3,607.9 | 3,662.4 | 3,578.7 | 3,525.2 | 3,455.6 | 3,249.7 |
| 2014 | 3,240.7 | 3,233.5 | 3,390.8 | 3,554.1 | 3,611.4 | 3,563.5 | 3,560.1 | 3,592.0 | 3,417.0 | 3,628.0 | 3,529.7 | 3,515.5 |
| 2015 | 3,348.1 | 3,234.0 | 3,381.5 | 3,589.8 | 3,560.9 | 3,602.5 | 3,732.6 | 3,464.5 | 3,605.2 | 3,628.7 | 3,498.6 | 3,554.7 |
| 2016 | 3,303.2 | 3,486.3 | 3,608.0 | 3,598.2 | 3,640.0 | 3,790.6 | 3,722.4 | 3,601.8 | 3,713.8 | 3,642.2 | 3,635.1 | 3,594.3 |
| 2017 | 3,185.7 | 3,355.3 | 3,601.7 | 3,583.1 | 3,682.2 | 3,771.5 | 3,646.5 | 3,685.3 | 3,643.3 | 3,547.5 | 3,578.1 | 3,536.6 |
| 2018 | 3,236.2 | 3,363.8 | 3,662.3 | 3,597.9 | 3,797.6 | 3,741.9 | 3,640.1 | 3,698.3 | 3,435.9 | 3,651.9 | 3,605.1 | 3,443.9 |
| 2019 | 3,299.3 | 3,351.6 | 3,450.5 | 3,546.4 | 3,620.2 | 3,578.9 | 3,570.4 | 3,541.9 | 3,518.9 | 3,613.5 | 3,546.4 | 3,460.2 |
| 2020 | 3,288.2 | 3,363.4 | 3,177.2 | 2,689.5 | 3,036.7 | 3,411.4 | 3,453.2 | 3,409.6 | 3,352.5 | 3,345.6 | 3,350.1 | 3,272.3 |
| 2021 | 3,264.7 | 2,880.7 | 3,526.7 | 3,727.5 | 3,732.7 | 3,745.8 | 3,820.5 | 3,669.4 | 3,614.7 | 3,608.8 | 3,558.5 | 3,445.9 |
| 2022 | 3,135.8 | 3,138.1 | 3,184.0 | |||||||||
| - = No Data Reported; -- = Not Applicable; NA = Not Available; W = Withheld to avoid disclosure of individual company data. |
| Release Date: 5/19/2022 |
| Next Release Date: TBD |