|
Download Data (XLS File) |
|
||||||||
|
||||||||
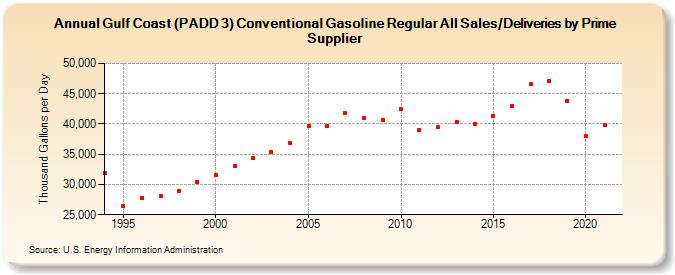
| Gulf Coast (PADD 3) Conventional Gasoline Regular All Sales/Deliveries by Prime Supplier (Thousand Gallons per Day) | ||||||||
| Decade | Year-0 | Year-1 | Year-2 | Year-3 | Year-4 | Year-5 | Year-6 | Year-7 | Year-8 | Year-9 |
|---|---|---|---|---|---|---|---|---|---|---|
| 1990's | 31,832.3 | 26,395.4 | 27,807.1 | 28,142.5 | 28,972.9 | 30,459.0 | ||||
| 2000's | 31,509.6 | 33,065.3 | 34,398.3 | 35,406.3 | 36,912.7 | 39,711.6 | 39,595.8 | 41,883.7 | 40,936.0 | 40,668.0 |
| 2010's | 42,417.2 | 38,950.7 | 39,572.3 | 40,327.6 | 40,054.4 | 41,366.6 | 43,006.6 | 46,557.2 | 47,155.3 | 43,806.8 |
| 2020's | 37,946.7 |
| - = No Data Reported; -- = Not Applicable; NA = Not Available; W = Withheld to avoid disclosure of individual company data. |
| Release Date: 6/1/2022 |
| Next Release Date: TBD |