|
Download Data (XLS File) |
|
||||||||
|
||||||||
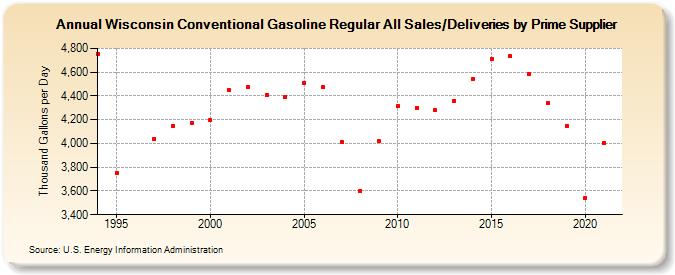
| Wisconsin Conventional Gasoline Regular All Sales/Deliveries by Prime Supplier (Thousand Gallons per Day) | ||||||||
| Decade | Year-0 | Year-1 | Year-2 | Year-3 | Year-4 | Year-5 | Year-6 | Year-7 | Year-8 | Year-9 |
|---|---|---|---|---|---|---|---|---|---|---|
| 1990's | 4,756.7 | 3,754.7 | W | 4,040.5 | 4,145.9 | 4,174.2 | ||||
| 2000's | 4,198.8 | 4,447.4 | 4,476.6 | 4,406.5 | 4,395.0 | 4,508.7 | 4,472.7 | 4,015.7 | 3,597.9 | 4,017.7 |
| 2010's | 4,315.9 | 4,301.0 | 4,278.5 | 4,357.7 | 4,544.4 | 4,713.8 | 4,732.5 | 4,585.6 | 4,339.1 | 4,149.7 |
| 2020's | 3,543.5 |
| - = No Data Reported; -- = Not Applicable; NA = Not Available; W = Withheld to avoid disclosure of individual company data. |
| Release Date: 6/1/2022 |
| Next Release Date: TBD |