|
Download Data (XLS File) |
|
||||||||
|
||||||||
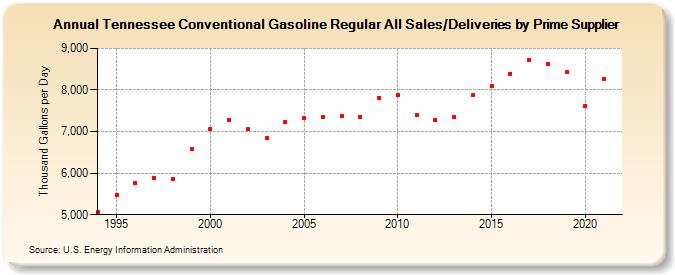
| Tennessee Conventional Gasoline Regular All Sales/Deliveries by Prime Supplier (Thousand Gallons per Day) | ||||||||
| Decade | Year-0 | Year-1 | Year-2 | Year-3 | Year-4 | Year-5 | Year-6 | Year-7 | Year-8 | Year-9 |
|---|---|---|---|---|---|---|---|---|---|---|
| 1990's | 5,061.4 | 5,473.3 | 5,756.9 | 5,892.1 | 5,861.3 | 6,573.0 | ||||
| 2000's | 7,072.5 | 7,283.1 | 7,056.4 | 6,833.7 | 7,220.2 | 7,322.7 | 7,355.3 | 7,368.7 | 7,359.2 | 7,805.2 |
| 2010's | 7,876.2 | 7,405.2 | 7,269.1 | 7,342.6 | 7,867.6 | 8,103.2 | 8,396.1 | 8,716.6 | 8,621.5 | 8,431.8 |
| 2020's | 7,623.9 |
| - = No Data Reported; -- = Not Applicable; NA = Not Available; W = Withheld to avoid disclosure of individual company data. |
| Release Date: 6/1/2022 |
| Next Release Date: TBD |