|
Download Data (XLS File) |
|
||||||||
|
||||||||
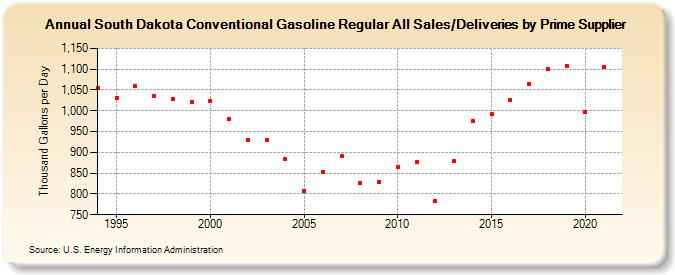
| South Dakota Conventional Gasoline Regular All Sales/Deliveries by Prime Supplier (Thousand Gallons per Day) | ||||||||
| Decade | Year-0 | Year-1 | Year-2 | Year-3 | Year-4 | Year-5 | Year-6 | Year-7 | Year-8 | Year-9 |
|---|---|---|---|---|---|---|---|---|---|---|
| 1990's | 1,054.4 | 1,030.8 | 1,058.6 | 1,036.6 | 1,029.3 | 1,021.5 | ||||
| 2000's | 1,022.7 | 979.4 | 930.3 | 928.9 | 883.0 | 805.9 | 853.0 | 890.8 | 825.4 | 828.7 |
| 2010's | 864.5 | 876.6 | 782.3 | 878.8 | 975.7 | 991.1 | 1,026.1 | 1,064.5 | 1,099.4 | 1,107.9 |
| 2020's | 996.4 |
| - = No Data Reported; -- = Not Applicable; NA = Not Available; W = Withheld to avoid disclosure of individual company data. |
| Release Date: 6/1/2022 |
| Next Release Date: TBD |