|
Download Data (XLS File) |
|
||||||||
|
||||||||
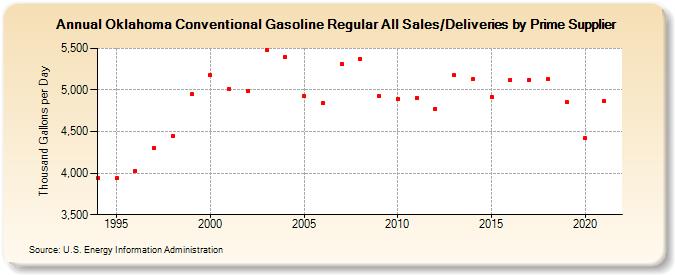
| Oklahoma Conventional Gasoline Regular All Sales/Deliveries by Prime Supplier (Thousand Gallons per Day) | ||||||||
| Decade | Year-0 | Year-1 | Year-2 | Year-3 | Year-4 | Year-5 | Year-6 | Year-7 | Year-8 | Year-9 |
|---|---|---|---|---|---|---|---|---|---|---|
| 1990's | 3,945.6 | 3,938.2 | 4,028.2 | 4,304.2 | 4,442.5 | 4,950.4 | ||||
| 2000's | 5,175.6 | 5,010.4 | 4,987.7 | 5,483.5 | 5,394.4 | 4,922.1 | 4,839.8 | 5,318.0 | 5,369.9 | 4,927.6 |
| 2010's | 4,894.9 | 4,907.8 | 4,776.5 | 5,174.8 | 5,128.5 | 4,917.6 | 5,125.7 | 5,124.6 | 5,126.8 | 4,853.3 |
| 2020's | 4,419.3 |
| - = No Data Reported; -- = Not Applicable; NA = Not Available; W = Withheld to avoid disclosure of individual company data. |
| Release Date: 6/1/2022 |
| Next Release Date: TBD |