|
Download Data (XLS File) |
|
||||||||
|
||||||||
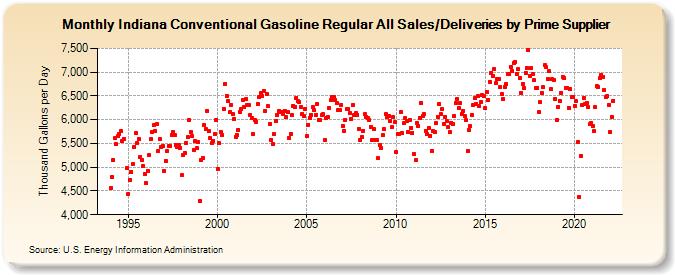
| Indiana Conventional Gasoline Regular All Sales/Deliveries by Prime Supplier (Thousand Gallons per Day) | ||||||||
| Year | Jan | Feb | Mar | Apr | May | Jun | Jul | Aug | Sep | Oct | Nov | Dec |
|---|---|---|---|---|---|---|---|---|---|---|---|---|
| 1993 | NA | NA | NA | |||||||||
| 1994 | 4,562.3 | 4,790.1 | 5,156.4 | 5,607.5 | 5,478.8 | 5,648.0 | 5,704.3 | 5,759.7 | 5,544.8 | 5,600.0 | W | 4,986.6 |
| 1995 | 4,446.0 | 4,731.1 | 4,904.6 | 5,075.3 | 5,432.9 | 5,714.5 | 5,503.6 | 5,595.2 | 5,216.1 | 5,157.3 | 5,022.4 | 4,857.3 |
| 1996 | 4,664.6 | 4,923.5 | 5,248.7 | 5,584.9 | 5,737.4 | 5,878.0 | 5,770.5 | 5,912.5 | 5,339.8 | 5,595.6 | 5,434.6 | 5,448.8 |
| 1997 | 4,927.5 | 5,134.7 | 5,342.2 | 5,450.1 | 5,455.7 | 5,679.2 | 5,740.8 | 5,687.5 | 5,474.6 | 5,428.6 | 5,472.9 | 5,399.7 |
| 1998 | 4,825.5 | 5,265.5 | 5,300.5 | 5,511.0 | 5,627.1 | 5,988.1 | 5,735.3 | 5,653.3 | 5,372.0 | 5,556.4 | 5,398.6 | 5,519.7 |
| 1999 | 4,290.1 | 5,161.3 | 5,199.1 | 5,888.3 | 5,813.8 | 6,184.1 | 5,754.7 | 5,616.3 | 5,506.0 | 5,558.5 | 5,695.3 | 5,993.3 |
| 2000 | 4,969.7 | 5,501.7 | 5,741.8 | 5,683.0 | 6,231.8 | 6,756.1 | 6,498.1 | 6,390.4 | 6,152.2 | 6,316.2 | 6,112.1 | 6,010.0 |
| 2001 | 5,644.0 | 5,681.9 | 5,789.0 | 6,168.2 | 6,216.0 | 6,424.2 | 6,266.5 | 6,431.9 | 6,308.8 | 6,306.6 | 6,093.8 | 6,026.4 |
| 2002 | 5,692.4 | 5,994.6 | 5,959.2 | 6,328.3 | 6,469.0 | 6,558.7 | 6,500.3 | 6,606.8 | 6,183.9 | 6,535.8 | 6,279.4 | 5,910.6 |
| 2003 | 5,575.9 | 5,489.1 | 5,695.1 | 5,964.6 | 6,095.9 | 6,172.2 | 6,161.2 | 6,152.8 | 6,125.6 | 6,189.6 | 6,048.2 | 6,161.1 |
| 2004 | 5,614.8 | 5,697.1 | 6,091.0 | 6,293.6 | 6,273.1 | 6,457.9 | 6,383.7 | 6,372.0 | 6,271.4 | 6,120.0 | 6,067.5 | 6,224.6 |
| 2005 | 5,647.2 | 5,895.0 | 6,045.2 | 6,101.4 | 6,259.3 | 6,196.2 | 6,105.7 | 6,337.8 | 5,986.1 | 5,996.3 | 6,108.4 | 6,110.9 |
| 2006 | 5,570.6 | 6,036.9 | 6,056.0 | 6,250.3 | 6,406.1 | 6,471.2 | 6,478.4 | 6,414.6 | 6,340.6 | 6,197.7 | 6,201.6 | 6,311.4 |
| 2007 | 5,873.1 | 5,770.5 | 6,003.5 | 6,230.7 | 6,227.4 | 6,139.1 | 6,022.0 | 6,311.9 | 6,093.7 | 6,140.1 | 6,104.4 | 5,811.5 |
| 2008 | 5,573.2 | 5,638.9 | 5,767.2 | 6,110.1 | 6,060.1 | 6,032.0 | 5,995.7 | 5,855.9 | 5,578.7 | 5,795.8 | 5,572.4 | 5,578.4 |
| 2009 | 5,185.7 | 5,475.1 | 5,408.4 | 5,673.5 | 5,794.5 | 6,111.4 | 6,045.9 | 6,074.8 | 5,972.8 | 5,838.0 | 6,060.7 | 5,941.3 |
| 2010 | 5,319.0 | 5,693.1 | 5,708.0 | 6,163.8 | 5,710.2 | 5,923.0 | 6,026.1 | 5,964.3 | 5,748.6 | 6,000.6 | 5,830.7 | 5,717.1 |
| 2011 | 5,277.9 | 5,144.4 | 5,935.5 | 5,869.4 | 6,043.7 | 6,361.3 | 6,072.8 | 6,111.6 | 5,767.7 | 5,690.6 | 5,819.9 | 5,664.8 |
| 2012 | 5,344.9 | 5,760.4 | 5,737.8 | 5,927.7 | 6,062.5 | 6,333.7 | 6,116.3 | 6,220.9 | 5,910.8 | 6,065.3 | 5,977.5 | 5,844.6 |
| 2013 | 5,737.5 | 5,939.4 | 5,916.5 | 6,077.6 | 6,350.3 | 6,432.7 | 6,255.4 | 6,351.3 | 6,122.5 | 6,192.4 | 6,079.8 | 5,983.2 |
| 2014 | 5,336.9 | 5,779.5 | 5,857.0 | 6,105.1 | 6,312.6 | 6,453.9 | 6,339.5 | 6,488.4 | 6,281.2 | 6,371.8 | 6,509.3 | 6,496.0 |
| 2015 | 6,242.1 | 6,578.1 | 6,409.0 | 6,802.6 | 6,989.2 | 6,925.7 | 7,065.9 | 6,780.7 | 6,852.3 | 6,862.9 | 6,686.1 | 6,537.8 |
| 2016 | 6,425.2 | 6,693.9 | 6,742.7 | 6,970.4 | 6,956.5 | 7,114.8 | 7,030.8 | 7,193.5 | 7,221.0 | 6,957.0 | 7,056.7 | 6,867.4 |
| 2017 | 6,567.3 | 6,755.6 | 6,670.3 | 6,989.8 | 7,089.2 | 7,457.1 | 6,926.2 | 7,082.8 | 6,970.6 | 6,828.9 | 6,665.6 | 6,673.1 |
| 2018 | 6,159.3 | 6,362.7 | 6,562.3 | 6,677.8 | 7,142.2 | 7,103.6 | 6,848.6 | 7,014.6 | 6,637.8 | 6,845.7 | 6,838.5 | 6,444.3 |
| 2019 | 5,988.3 | 6,273.3 | 6,402.4 | 6,569.5 | 6,907.9 | 6,870.4 | 6,673.9 | 6,675.3 | 6,255.0 | 6,642.3 | 6,472.1 | 6,478.9 |
| 2020 | 6,289.0 | 6,384.4 | 5,528.1 | 4,376.1 | 5,240.1 | 6,310.4 | 6,461.7 | 6,329.9 | 6,356.7 | 6,256.2 | 5,900.8 | 5,931.3 |
| 2021 | 5,863.4 | 5,758.9 | 6,262.6 | 6,703.1 | 6,691.9 | 6,878.4 | 6,936.7 | 6,908.0 | 6,615.1 | 6,482.3 | 6,487.7 | 6,316.9 |
| 2022 | 5,744.1 | 6,063.2 | 6,388.4 | |||||||||
| - = No Data Reported; -- = Not Applicable; NA = Not Available; W = Withheld to avoid disclosure of individual company data. |
| Release Date: 5/19/2022 |
| Next Release Date: TBD |