|
Download Data (XLS File) |
|
||||||||
|
||||||||
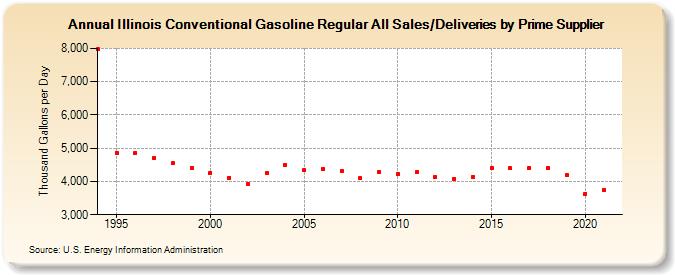
| Illinois Conventional Gasoline Regular All Sales/Deliveries by Prime Supplier (Thousand Gallons per Day) | ||||||||
| Decade | Year-0 | Year-1 | Year-2 | Year-3 | Year-4 | Year-5 | Year-6 | Year-7 | Year-8 | Year-9 |
|---|---|---|---|---|---|---|---|---|---|---|
| 1990's | 7,967.2 | 4,867.8 | 4,860.7 | 4,709.0 | 4,545.0 | 4,411.5 | ||||
| 2000's | 4,267.9 | 4,112.8 | 3,926.3 | 4,251.1 | 4,494.7 | 4,338.9 | 4,378.9 | 4,326.7 | 4,098.2 | 4,284.5 |
| 2010's | 4,224.1 | 4,270.1 | 4,133.7 | 4,085.1 | 4,145.7 | 4,416.0 | 4,394.1 | 4,404.8 | 4,409.0 | 4,199.9 |
| 2020's | 3,634.6 |
| - = No Data Reported; -- = Not Applicable; NA = Not Available; W = Withheld to avoid disclosure of individual company data. |
| Release Date: 6/1/2022 |
| Next Release Date: TBD |