|
Download Data (XLS File) |
|
||||||||
|
||||||||
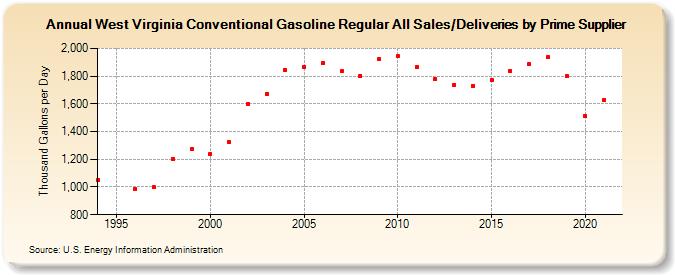
| West Virginia Conventional Gasoline Regular All Sales/Deliveries by Prime Supplier (Thousand Gallons per Day) | ||||||||
| Decade | Year-0 | Year-1 | Year-2 | Year-3 | Year-4 | Year-5 | Year-6 | Year-7 | Year-8 | Year-9 |
|---|---|---|---|---|---|---|---|---|---|---|
| 1990's | 1,047.3 | W | 986.0 | 996.8 | 1,203.9 | 1,275.2 | ||||
| 2000's | 1,238.5 | 1,321.7 | 1,597.7 | 1,672.8 | 1,844.4 | 1,866.4 | 1,897.8 | 1,834.5 | 1,804.4 | 1,924.4 |
| 2010's | 1,942.2 | 1,864.2 | 1,778.2 | 1,735.9 | 1,731.9 | 1,773.5 | 1,836.0 | 1,885.6 | 1,937.3 | 1,798.5 |
| 2020's | 1,510.9 |
| - = No Data Reported; -- = Not Applicable; NA = Not Available; W = Withheld to avoid disclosure of individual company data. |
| Release Date: 6/1/2022 |
| Next Release Date: TBD |