|
Download Data (XLS File) |
|
||||||||
|
||||||||
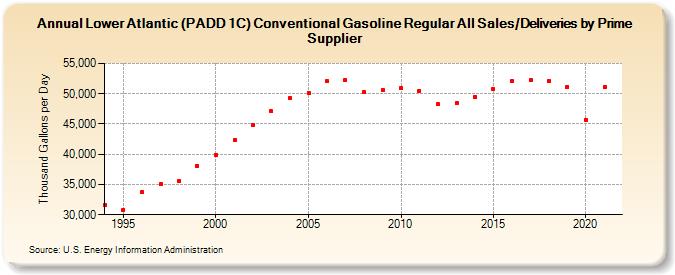
| Lower Atlantic (PADD 1C) Conventional Gasoline Regular All Sales/Deliveries by Prime Supplier (Thousand Gallons per Day) | ||||||||
| Decade | Year-0 | Year-1 | Year-2 | Year-3 | Year-4 | Year-5 | Year-6 | Year-7 | Year-8 | Year-9 |
|---|---|---|---|---|---|---|---|---|---|---|
| 1990's | 31,635.4 | 30,845.2 | 33,695.3 | 35,046.2 | 35,556.9 | 38,067.8 | ||||
| 2000's | 39,919.5 | 42,316.6 | 44,880.8 | 47,066.5 | 49,320.9 | 50,172.2 | 52,038.6 | 52,235.8 | 50,281.7 | 50,653.9 |
| 2010's | 50,920.6 | 50,502.6 | 48,251.6 | 48,430.2 | 49,495.4 | 50,803.7 | 52,128.8 | 52,207.2 | 52,095.4 | 51,174.1 |
| 2020's | 45,720.7 |
| - = No Data Reported; -- = Not Applicable; NA = Not Available; W = Withheld to avoid disclosure of individual company data. |
| Release Date: 6/1/2022 |
| Next Release Date: TBD |