|
Download Data (XLS File) |
|
||||||||
|
||||||||
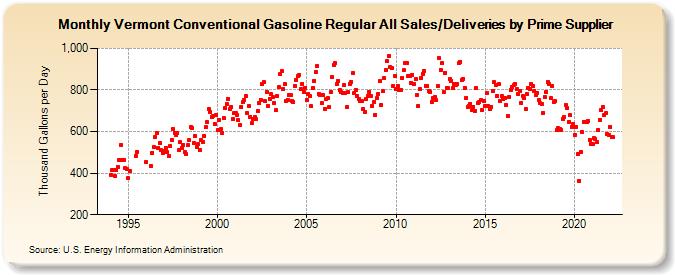
| Vermont Conventional Gasoline Regular All Sales/Deliveries by Prime Supplier (Thousand Gallons per Day) | ||||||||
| Year | Jan | Feb | Mar | Apr | May | Jun | Jul | Aug | Sep | Oct | Nov | Dec |
|---|---|---|---|---|---|---|---|---|---|---|---|---|
| 1993 | NA | NA | NA | |||||||||
| 1994 | 392.5 | 412.8 | 414.9 | 385.0 | 415.2 | 431.2 | 462.9 | 537.2 | 461.2 | 465.0 | 422.6 | 419.8 |
| 1995 | 376.4 | 410.4 | W | W | W | 482.7 | 501.8 | W | W | W | W | W |
| 1996 | 452.8 | W | W | 434.8 | 499.0 | 524.9 | 574.2 | 592.1 | 522.6 | 545.4 | 509.8 | 495.7 |
| 1997 | 505.0 | 523.1 | 499.7 | 481.3 | 530.0 | 560.0 | 610.7 | 594.8 | 582.7 | 590.7 | 510.0 | 547.4 |
| 1998 | 523.2 | 535.8 | 501.4 | 491.9 | 534.2 | 557.1 | 620.6 | 616.5 | 546.0 | 577.2 | 525.8 | 538.4 |
| 1999 | 511.9 | 557.7 | 548.9 | 579.6 | 620.0 | 643.9 | 706.8 | 694.2 | 671.0 | 675.6 | 637.3 | 681.9 |
| 2000 | 607.3 | 656.1 | 611.0 | 593.0 | 666.2 | 712.8 | 732.9 | 755.9 | 708.7 | 718.6 | 660.4 | 689.9 |
| 2001 | 687.3 | 678.8 | 655.1 | 633.1 | 719.1 | 739.8 | 749.5 | 769.5 | 687.6 | 723.9 | 672.3 | 641.6 |
| 2002 | 661.2 | 669.1 | 658.3 | 699.6 | 736.5 | 752.4 | 828.3 | 837.5 | 744.7 | 790.7 | 722.5 | 758.6 |
| 2003 | 778.8 | 764.6 | 739.7 | 701.5 | 772.3 | 812.4 | 876.2 | 889.4 | 805.8 | 829.9 | 748.9 | 753.8 |
| 2004 | 776.6 | 776.4 | 747.3 | 739.8 | 821.2 | 849.7 | 865.5 | 873.7 | 806.7 | 830.5 | 788.2 | 811.6 |
| 2005 | 751.1 | 782.1 | 769.4 | 721.2 | 810.2 | 845.0 | 886.1 | 914.0 | 781.9 | 776.9 | 735.7 | 776.6 |
| 2006 | 709.8 | 756.0 | 759.1 | 718.4 | 789.9 | 861.5 | 920.7 | 929.3 | 827.2 | 845.5 | 799.0 | 788.9 |
| 2007 | 786.8 | 821.8 | 784.9 | 718.3 | 789.4 | 829.3 | 840.1 | 880.5 | 783.3 | 801.7 | 770.9 | 757.8 |
| 2008 | 745.0 | 748.4 | 709.1 | 694.5 | 755.5 | 771.3 | 792.1 | 772.3 | 724.7 | 744.3 | 681.4 | 760.0 |
| 2009 | 782.6 | 840.9 | 728.5 | 793.5 | 855.5 | 897.0 | 937.6 | 962.1 | 909.8 | 903.9 | 819.9 | 869.3 |
| 2010 | 804.2 | 818.9 | 800.4 | 799.6 | 859.9 | 894.2 | 929.5 | 931.2 | 865.5 | 864.9 | 835.2 | 871.4 |
| 2011 | 831.0 | 852.9 | 777.7 | 725.2 | 803.2 | 859.5 | 877.7 | 890.5 | 820.5 | 819.7 | 795.7 | 791.0 |
| 2012 | 744.4 | 759.5 | 765.7 | 751.2 | 818.0 | 952.8 | 898.3 | 929.0 | 790.5 | 883.6 | 811.3 | 810.2 |
| 2013 | 850.4 | 844.9 | 809.2 | 830.8 | 822.6 | 829.8 | 927.5 | 936.7 | 849.2 | 854.5 | 811.1 | 762.9 |
| 2014 | 719.0 | 725.1 | 733.9 | 703.4 | 719.5 | 698.9 | 809.1 | 737.8 | 742.9 | 751.5 | 702.3 | 749.0 |
| 2015 | 725.0 | 784.8 | 722.5 | 708.9 | 719.9 | 795.3 | 838.3 | 826.0 | 770.8 | 829.5 | 748.4 | 768.8 |
| 2016 | 756.0 | 761.0 | 728.0 | 676.5 | 767.5 | 801.2 | 815.5 | 823.5 | 831.0 | 805.2 | 778.9 | 795.7 |
| 2017 | 739.6 | 770.9 | 761.8 | 709.6 | 782.1 | 811.4 | 805.1 | 828.2 | 817.3 | 796.9 | 775.6 | 787.3 |
| 2018 | 750.8 | 735.3 | 733.3 | 689.7 | 767.8 | 789.9 | 838.7 | 828.3 | 760.1 | 820.1 | 743.1 | 744.8 |
| 2019 | 606.5 | 615.5 | 613.5 | 606.4 | 661.9 | 671.0 | 728.7 | 714.2 | 647.5 | 677.3 | 623.6 | 636.0 |
| 2020 | 583.7 | 624.2 | 492.0 | 363.6 | 501.0 | 596.5 | 648.3 | 647.5 | 645.0 | 652.4 | 560.5 | 540.9 |
| 2021 | 542.0 | 567.4 | 563.0 | 548.4 | 609.5 | 657.7 | 702.5 | 718.8 | 677.6 | 687.7 | 587.8 | 583.8 |
| 2022 | 623.5 | 573.2 | 571.4 | |||||||||
| - = No Data Reported; -- = Not Applicable; NA = Not Available; W = Withheld to avoid disclosure of individual company data. |
| Release Date: 5/19/2022 |
| Next Release Date: TBD |