|
Download Data (XLS File) |
|
||||||||
|
||||||||
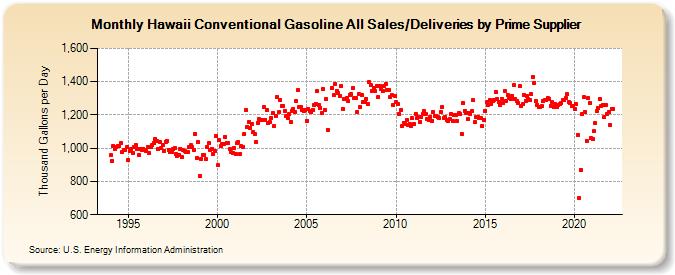
| Hawaii Conventional Gasoline All Sales/Deliveries by Prime Supplier (Thousand Gallons per Day) | ||||||||
| Year | Jan | Feb | Mar | Apr | May | Jun | Jul | Aug | Sep | Oct | Nov | Dec |
|---|---|---|---|---|---|---|---|---|---|---|---|---|
| 1993 | NA | NA | NA | |||||||||
| 1994 | 956.5 | 924.7 | 1,015.7 | 995.1 | 1,006.1 | 1,010.7 | 1,014.4 | 1,031.4 | 975.2 | 987.7 | 991.5 | 1,004.3 |
| 1995 | 928.1 | 983.5 | 992.6 | 971.9 | 1,007.4 | 1,021.9 | 996.0 | 959.6 | 992.5 | 988.4 | 996.5 | 986.7 |
| 1996 | 985.9 | 1,007.1 | 969.9 | 1,004.4 | 1,018.1 | 1,029.9 | 1,053.3 | 1,043.5 | 997.6 | 1,038.6 | 1,003.3 | 1,018.4 |
| 1997 | 984.6 | 1,039.6 | 1,044.3 | 991.6 | 976.3 | 974.1 | 994.9 | 1,000.6 | 964.6 | 955.1 | 959.2 | 996.2 |
| 1998 | 944.4 | 986.8 | 982.2 | 976.9 | 975.7 | 1,006.6 | 1,016.2 | 1,005.4 | 986.8 | 1,086.5 | 943.4 | 1,036.9 |
| 1999 | 832.9 | 933.6 | 959.2 | 961.2 | 932.1 | 1,008.0 | 1,030.8 | 991.1 | 996.0 | 967.4 | 983.2 | 1,073.0 |
| 2000 | 895.9 | 1,047.8 | 1,013.0 | 1,026.9 | 1,027.5 | 1,069.1 | 1,032.9 | 1,031.9 | 992.9 | 974.7 | 969.6 | 1,000.6 |
| 2001 | 964.5 | 1,028.5 | 1,038.6 | 966.2 | 1,012.7 | 1,006.1 | 1,088.1 | 1,229.2 | 1,129.1 | 1,157.7 | 1,122.8 | 1,142.7 |
| 2002 | 1,097.3 | 1,082.8 | 1,037.4 | 1,153.8 | 1,173.3 | 1,169.0 | 1,171.2 | 1,245.0 | 1,171.1 | 1,229.7 | 1,148.6 | 1,158.1 |
| 2003 | 1,181.2 | 1,209.1 | 1,132.2 | 1,195.5 | 1,306.4 | 1,214.8 | 1,289.6 | 1,253.1 | 1,253.7 | 1,225.3 | 1,191.0 | 1,180.3 |
| 2004 | 1,203.5 | 1,158.5 | 1,226.0 | 1,237.0 | 1,220.3 | 1,282.8 | 1,349.4 | 1,244.8 | 1,245.5 | 1,228.1 | 1,223.0 | 1,230.4 |
| 2005 | 1,164.0 | 1,238.3 | 1,221.4 | 1,215.6 | 1,232.2 | 1,262.3 | 1,265.8 | 1,342.5 | 1,259.7 | 1,244.1 | 1,212.2 | 1,353.3 |
| 2006 | 1,230.3 | 1,295.0 | 1,111.3 | NA | NA | 1,361.0 | 1,319.5 | 1,385.2 | 1,346.0 | 1,330.5 | 1,315.8 | 1,371.9 |
| 2007 | 1,237.0 | 1,293.4 | 1,297.3 | 1,304.3 | 1,282.6 | 1,321.1 | 1,324.3 | 1,362.9 | 1,302.0 | 1,301.9 | 1,218.0 | 1,322.8 |
| 2008 | 1,247.6 | 1,321.1 | 1,275.4 | 1,279.3 | 1,298.7 | 1,264.1 | 1,395.1 | 1,379.3 | 1,344.5 | 1,362.2 | 1,341.6 | 1,373.3 |
| 2009 | 1,304.8 | 1,373.0 | 1,353.4 | 1,343.1 | 1,374.8 | 1,384.1 | 1,348.4 | 1,351.0 | 1,310.0 | 1,318.5 | 1,260.7 | 1,313.0 |
| 2010 | 1,275.3 | 1,266.1 | 1,206.6 | 1,230.4 | 1,130.8 | 1,152.5 | 1,147.9 | 1,168.3 | 1,137.3 | 1,145.9 | 1,132.2 | 1,179.2 |
| 2011 | 1,148.0 | 1,207.2 | 1,179.1 | 1,189.2 | 1,158.8 | 1,187.1 | 1,206.3 | 1,221.1 | 1,206.2 | 1,177.3 | 1,169.4 | 1,189.1 |
| 2012 | 1,165.5 | 1,217.3 | 1,193.0 | 1,191.9 | 1,186.7 | 1,180.4 | 1,218.2 | 1,245.2 | 1,183.5 | 1,187.5 | 1,168.7 | 1,161.8 |
| 2013 | 1,174.6 | 1,204.2 | 1,161.2 | 1,202.1 | 1,197.2 | 1,164.8 | 1,208.8 | 1,208.3 | 1,087.9 | 1,272.9 | 1,225.1 | 1,210.8 |
| 2014 | 1,175.2 | 1,211.3 | 1,207.8 | 1,221.6 | 1,287.9 | 1,154.7 | 1,189.0 | 1,189.1 | 1,183.0 | 1,179.0 | 1,132.6 | 1,170.6 |
| 2015 | 1,225.3 | 1,276.3 | 1,261.0 | 1,290.8 | 1,266.9 | 1,281.8 | 1,290.5 | 1,337.6 | 1,296.5 | 1,278.6 | 1,257.6 | 1,298.3 |
| 2016 | 1,273.1 | 1,344.5 | 1,285.9 | 1,317.1 | 1,300.6 | 1,293.6 | 1,314.6 | 1,376.9 | 1,294.4 | 1,285.8 | 1,273.0 | 1,371.2 |
| 2017 | 1,254.2 | 1,263.5 | 1,322.1 | 1,284.8 | 1,315.7 | 1,293.2 | 1,289.9 | 1,323.4 | 1,428.0 | 1,394.6 | 1,283.3 | 1,261.4 |
| 2018 | 1,244.7 | 1,248.1 | 1,252.1 | 1,282.7 | 1,289.5 | 1,291.3 | 1,302.2 | 1,297.7 | 1,255.4 | 1,275.6 | 1,249.7 | 1,266.1 |
| 2019 | 1,246.4 | 1,257.3 | 1,265.5 | 1,272.1 | 1,287.6 | 1,289.3 | 1,304.2 | 1,322.8 | 1,278.9 | 1,268.9 | 1,252.0 | 1,253.4 |
| 2020 | 1,236.9 | 1,263.3 | 1,078.3 | 697.6 | 871.2 | 1,205.1 | 1,305.6 | 1,220.1 | 1,044.9 | 1,299.6 | 1,274.6 | 1,060.9 |
| 2021 | 1,056.2 | 1,101.2 | 1,150.5 | 1,222.0 | 1,241.3 | 1,294.6 | 1,250.7 | 1,259.4 | 1,189.2 | 1,259.8 | 1,208.2 | 1,216.6 |
| 2022 | 1,140.2 | 1,236.5 | 1,234.2 | |||||||||
| - = No Data Reported; -- = Not Applicable; NA = Not Available; W = Withheld to avoid disclosure of individual company data. |
| Release Date: 5/19/2022 |
| Next Release Date: TBD |