|
Download Data (XLS File) |
|
||||||||
|
||||||||
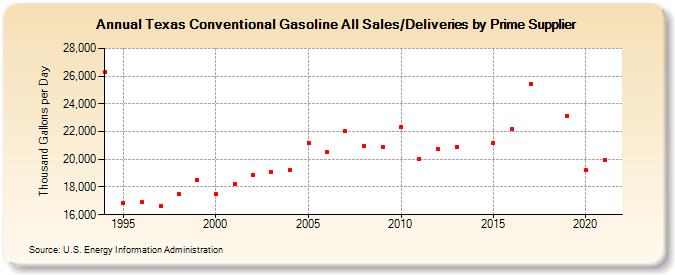
| Texas Conventional Gasoline All Sales/Deliveries by Prime Supplier (Thousand Gallons per Day) | ||||||||
| Decade | Year-0 | Year-1 | Year-2 | Year-3 | Year-4 | Year-5 | Year-6 | Year-7 | Year-8 | Year-9 |
|---|---|---|---|---|---|---|---|---|---|---|
| 1990's | 26,273.6 | 16,828.2 | 16,920.3 | 16,597.1 | 17,476.0 | 18,505.5 | ||||
| 2000's | 17,492.8 | 18,210.4 | 18,888.1 | 19,059.7 | 19,248.0 | 21,179.4 | 20,522.4 | 22,037.9 | 20,958.2 | 20,881.5 |
| 2010's | 22,305.4 | 20,049.2 | 20,719.5 | 20,902.8 | W | 21,168.6 | 22,190.5 | 25,451.9 | W | 23,137.6 |
| 2020's | 19,225.4 |
| - = No Data Reported; -- = Not Applicable; NA = Not Available; W = Withheld to avoid disclosure of individual company data. |
| Release Date: 6/1/2022 |
| Next Release Date: TBD |