|
Download Data (XLS File) |
|
||||||||
|
||||||||
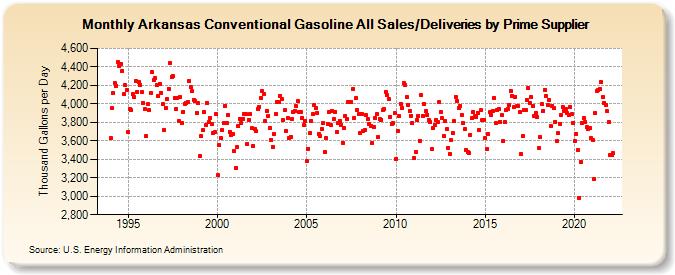
| Arkansas Conventional Gasoline All Sales/Deliveries by Prime Supplier (Thousand Gallons per Day) | ||||||||
| Year | Jan | Feb | Mar | Apr | May | Jun | Jul | Aug | Sep | Oct | Nov | Dec |
|---|---|---|---|---|---|---|---|---|---|---|---|---|
| 1993 | NA | NA | NA | |||||||||
| 1994 | 3,627.6 | 3,950.9 | 4,114.2 | 4,221.5 | 4,196.4 | 4,451.3 | 4,406.7 | 4,435.3 | 4,358.4 | 4,103.1 | 4,199.7 | 4,154.9 |
| 1995 | 3,699.6 | 3,943.8 | 3,931.0 | 4,101.9 | 4,074.2 | 4,246.1 | 4,132.1 | 4,234.6 | 4,207.5 | 4,124.2 | 4,012.0 | 3,943.8 |
| 1996 | 3,650.2 | 3,996.1 | 3,931.2 | 4,114.4 | 4,341.2 | 4,256.9 | 4,280.4 | 4,205.8 | 4,085.2 | 4,219.4 | 4,118.9 | 3,997.6 |
| 1997 | 3,718.3 | 3,958.5 | 4,054.7 | 4,163.3 | 4,439.6 | 4,293.8 | 4,296.9 | 4,063.6 | 3,947.8 | 4,067.0 | 3,816.6 | 4,073.9 |
| 1998 | 3,791.5 | 3,916.3 | 4,002.0 | 4,009.6 | 4,019.6 | 4,245.0 | 4,177.7 | 4,136.2 | 4,045.6 | 4,030.1 | 3,904.6 | 4,006.2 |
| 1999 | 3,430.4 | 3,647.0 | 3,712.3 | 3,911.2 | 3,767.0 | 4,009.4 | 3,803.2 | 3,851.5 | 3,776.8 | 3,679.8 | 3,694.9 | 3,889.0 |
| 2000 | 3,224.5 | 3,553.8 | 3,630.4 | 3,718.1 | 3,789.8 | 3,981.4 | 3,795.9 | 3,880.6 | 3,699.6 | 3,666.8 | 3,673.3 | 3,489.5 |
| 2001 | 3,309.8 | 3,530.5 | 3,756.9 | 3,839.4 | 3,792.7 | 3,840.1 | 3,890.0 | 3,889.4 | 3,566.7 | 3,829.5 | 3,888.2 | 3,734.2 |
| 2002 | 3,544.9 | 3,725.3 | 3,701.5 | 3,949.0 | 3,968.2 | 4,057.9 | 4,137.9 | 4,110.9 | 3,814.0 | 3,927.4 | 3,869.5 | 3,741.5 |
| 2003 | 3,611.1 | 3,533.0 | 3,678.0 | 3,892.4 | 4,015.1 | 4,017.0 | 4,088.6 | 4,051.9 | 3,827.9 | 3,929.3 | 3,706.9 | 3,847.0 |
| 2004 | 3,632.0 | 3,645.3 | 3,834.4 | 3,906.7 | 3,927.7 | 3,971.9 | 4,027.9 | 3,913.0 | 3,911.9 | 3,847.3 | 3,769.3 | 3,814.8 |
| 2005 | 3,376.3 | 3,516.2 | 3,685.8 | 3,813.4 | 3,888.6 | 3,982.8 | 3,958.6 | 3,898.1 | 3,671.2 | 3,651.9 | 3,730.1 | 3,794.4 |
| 2006 | 3,481.0 | 3,628.8 | 3,787.0 | 3,912.6 | 3,769.6 | 3,920.5 | 3,835.6 | 3,915.7 | 3,693.5 | 3,789.0 | 3,818.7 | 3,776.2 |
| 2007 | 3,579.5 | 3,742.6 | 3,865.9 | 3,832.8 | 4,018.1 | 4,023.9 | 4,020.8 | 4,159.2 | 3,848.5 | 4,059.1 | 3,938.1 | 3,885.9 |
| 2008 | 3,684.4 | 3,892.3 | 3,710.8 | 3,717.8 | 3,874.5 | 3,834.7 | 3,782.5 | 3,757.5 | 3,573.6 | 3,754.0 | 3,844.5 | 3,884.6 |
| 2009 | 3,640.9 | 3,834.7 | 3,829.0 | 3,930.6 | 3,942.9 | 4,130.2 | 4,092.8 | 4,050.7 | 3,859.0 | 3,778.6 | 3,795.2 | 3,895.6 |
| 2010 | 3,408.2 | 3,709.3 | 3,864.5 | 4,001.0 | 3,956.7 | 4,226.9 | 4,207.8 | 4,078.4 | 3,991.1 | 3,921.3 | 3,872.6 | 3,797.2 |
| 2011 | 3,409.9 | 3,483.9 | 3,830.0 | 3,872.4 | 3,601.3 | 4,091.4 | 3,867.0 | 3,997.5 | 3,919.2 | 3,884.2 | 3,820.3 | 3,801.0 |
| 2012 | 3,515.8 | 3,741.7 | 3,771.8 | 3,827.6 | 3,800.7 | 4,018.0 | 3,913.0 | 3,841.7 | 3,650.9 | 3,809.4 | 3,723.2 | 3,526.8 |
| 2013 | 3,458.9 | 3,603.9 | 3,684.7 | 3,808.8 | 4,077.2 | 4,030.8 | 3,954.8 | 3,974.4 | 3,883.6 | 3,794.0 | 3,723.3 | 3,503.4 |
| 2014 | 3,480.6 | 3,469.3 | 3,665.0 | 3,841.5 | 3,910.1 | 3,864.0 | 3,862.8 | 3,902.7 | 3,718.7 | 3,928.1 | 3,829.0 | 3,820.7 |
| 2015 | 3,629.5 | 3,506.6 | 3,671.4 | 3,906.9 | 3,874.3 | 3,917.8 | 4,066.3 | 3,789.3 | 3,937.4 | 3,948.5 | 3,806.8 | 3,875.6 |
| 2016 | 3,597.7 | 3,807.7 | 3,935.5 | 3,942.3 | 3,984.2 | 4,141.8 | 4,088.9 | 3,962.2 | 4,075.6 | 3,975.7 | 3,977.8 | 3,908.7 |
| 2017 | 3,454.8 | 3,650.4 | 3,928.8 | 3,937.2 | 4,045.8 | 4,169.4 | 4,012.2 | 4,072.6 | 3,978.0 | 3,870.2 | 3,903.8 | 3,857.6 |
| 2018 | 3,518.7 | 3,639.0 | 3,996.0 | 3,926.0 | 4,151.4 | 4,084.3 | 3,984.5 | 4,040.6 | 3,761.7 | 3,979.6 | 3,951.0 | 3,806.1 |
| 2019 | 3,595.3 | 3,679.7 | 3,786.0 | 3,878.0 | 3,963.5 | 3,925.9 | 3,938.9 | 3,900.2 | 3,876.9 | 3,966.1 | 3,889.7 | 3,792.3 |
| 2020 | 3,592.6 | 3,678.2 | 3,498.1 | 2,984.4 | 3,371.5 | 3,793.2 | 3,846.5 | 3,807.8 | 3,748.3 | 3,730.2 | 3,736.0 | 3,629.9 |
| 2021 | 3,612.3 | 3,188.4 | 3,902.6 | 4,144.1 | 4,147.0 | 4,160.3 | 4,236.8 | 4,073.7 | 4,009.5 | 3,982.5 | 3,918.2 | 3,806.0 |
| 2022 | 3,442.6 | 3,446.4 | 3,464.1 | |||||||||
| - = No Data Reported; -- = Not Applicable; NA = Not Available; W = Withheld to avoid disclosure of individual company data. |
| Release Date: 5/19/2022 |
| Next Release Date: TBD |