|
Download Data (XLS File) |
|
||||||||
|
||||||||
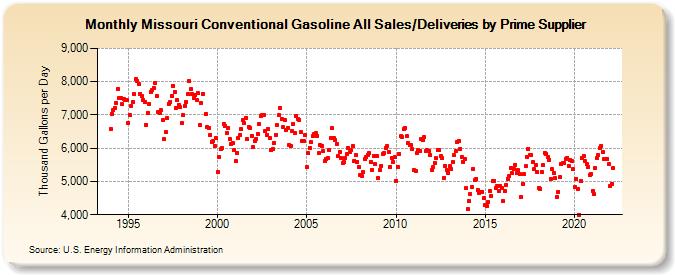
| Missouri Conventional Gasoline All Sales/Deliveries by Prime Supplier (Thousand Gallons per Day) | ||||||||
| Year | Jan | Feb | Mar | Apr | May | Jun | Jul | Aug | Sep | Oct | Nov | Dec |
|---|---|---|---|---|---|---|---|---|---|---|---|---|
| 1993 | NA | NA | NA | |||||||||
| 1994 | 6,574.6 | 7,035.4 | 7,153.4 | 7,223.0 | 7,361.8 | 7,780.9 | 7,513.5 | 7,495.9 | 7,315.8 | 7,472.0 | 7,436.2 | 7,443.6 |
| 1995 | 6,754.8 | 6,986.5 | 7,280.0 | 7,397.2 | 7,620.9 | 8,091.5 | 8,023.2 | 7,933.4 | 7,643.8 | 7,555.0 | 7,442.5 | 7,383.8 |
| 1996 | 6,708.4 | 7,066.2 | 7,331.2 | 7,694.2 | 7,739.2 | 7,812.2 | 7,966.5 | 7,576.5 | 7,096.3 | 7,049.5 | 7,133.1 | 6,844.3 |
| 1997 | 6,272.4 | 6,486.4 | 6,906.7 | 7,337.0 | 7,398.0 | 7,582.5 | 7,880.0 | 7,692.5 | 7,221.3 | 7,436.4 | 7,310.9 | 7,235.0 |
| 1998 | 6,751.1 | 6,988.7 | 7,278.2 | 7,394.8 | 7,633.9 | 8,010.3 | 7,767.5 | 7,631.7 | 7,516.8 | 7,588.1 | 7,441.6 | 7,645.5 |
| 1999 | 6,682.3 | 7,353.5 | 7,629.6 | W | 7,035.1 | 6,627.3 | 6,601.4 | 6,405.1 | 6,193.0 | 6,213.6 | 6,070.7 | 6,300.5 |
| 2000 | 5,291.9 | 5,744.9 | 5,964.9 | 6,000.0 | 6,741.3 | 6,659.6 | 6,466.0 | 6,616.3 | 6,283.3 | 6,138.6 | 6,168.0 | 5,941.3 |
| 2001 | 5,605.8 | 5,853.5 | 6,291.2 | 6,408.9 | 6,572.6 | 6,840.6 | 6,746.9 | 6,920.7 | 6,262.2 | 6,633.1 | 6,617.0 | 6,379.0 |
| 2002 | 6,029.9 | 6,216.2 | 6,287.4 | 6,431.4 | 6,731.9 | 6,954.0 | 7,003.3 | 6,983.9 | 6,501.8 | 6,403.6 | 6,586.1 | 6,310.0 |
| 2003 | 5,944.0 | 5,978.3 | 6,166.6 | 6,407.8 | 6,687.5 | 6,988.1 | 7,211.0 | 6,879.8 | 6,633.6 | 6,845.3 | 6,556.9 | 6,618.7 |
| 2004 | 6,092.4 | 6,054.1 | 6,502.3 | 6,741.4 | 6,457.7 | 6,977.8 | 6,885.1 | 6,843.5 | 6,479.7 | 6,223.1 | 6,205.9 | 6,384.3 |
| 2005 | 5,423.7 | 5,847.1 | 6,019.7 | 6,172.6 | 6,363.1 | 6,418.2 | 6,446.6 | 6,368.1 | 5,845.5 | 6,092.2 | 6,075.0 | 5,910.6 |
| 2006 | 5,625.4 | 5,673.4 | 5,691.8 | 5,940.9 | 6,296.1 | 6,595.1 | 6,300.1 | 6,241.2 | 6,136.4 | 5,761.4 | 5,897.7 | 5,716.2 |
| 2007 | 5,541.2 | 5,570.3 | 5,703.2 | 5,821.1 | 6,008.7 | 5,890.6 | 5,944.7 | 6,059.1 | 5,623.7 | 5,783.8 | 5,597.8 | 5,441.8 |
| 2008 | 5,184.5 | 5,167.7 | 5,275.4 | 5,667.1 | 5,731.9 | 5,806.4 | 5,852.1 | 5,591.4 | 5,345.1 | 5,776.3 | 5,522.1 | 5,772.1 |
| 2009 | 5,099.7 | 5,336.2 | 5,468.1 | 5,813.9 | 5,859.8 | 6,017.6 | 6,057.6 | 5,878.4 | 5,447.9 | 5,702.4 | 5,579.7 | 5,726.2 |
| 2010 | 5,022.0 | 5,437.5 | 5,838.2 | 6,352.0 | 6,349.3 | 6,570.0 | 6,608.5 | 6,356.6 | 6,169.4 | 6,081.5 | 6,086.5 | 5,966.8 |
| 2011 | 5,336.8 | 5,321.7 | 5,852.5 | 5,944.0 | 5,917.6 | 6,289.1 | 6,245.4 | 6,332.1 | 5,927.9 | 5,937.5 | 5,912.9 | 5,784.2 |
| 2012 | 5,350.5 | 5,422.0 | 5,562.8 | 5,692.0 | 5,945.0 | 5,952.1 | 5,755.8 | 5,711.4 | 5,109.1 | 5,470.0 | 5,347.8 | 5,263.1 |
| 2013 | 5,456.1 | 5,374.9 | 5,592.0 | 5,789.9 | 5,910.7 | 6,181.9 | 6,230.3 | 5,989.8 | 5,746.3 | 5,585.5 | 5,662.8 | 4,799.0 |
| 2014 | 4,170.6 | 4,423.9 | 4,623.7 | 4,833.7 | 5,385.4 | 5,031.4 | 5,077.0 | 4,728.5 | 4,640.1 | 4,680.2 | 4,683.0 | 4,491.0 |
| 2015 | 4,283.1 | 4,256.6 | 4,384.9 | 4,710.7 | 4,573.8 | 5,012.6 | 5,013.8 | 4,808.4 | 4,869.5 | 4,717.6 | 4,869.8 | 4,803.3 |
| 2016 | 4,398.2 | 4,709.9 | 4,894.6 | 5,086.8 | 5,169.1 | 5,410.9 | 5,241.8 | 5,388.8 | 5,504.8 | 5,250.1 | 5,335.0 | 5,220.0 |
| 2017 | 4,517.9 | 4,926.9 | 5,210.5 | 5,449.6 | 5,738.1 | 5,976.0 | 5,792.8 | 5,794.6 | 5,590.8 | 5,371.5 | 5,501.9 | 5,272.3 |
| 2018 | 4,815.3 | 4,776.0 | 5,281.7 | 5,480.9 | 5,866.2 | 5,836.4 | 5,741.5 | 5,647.9 | 5,083.3 | 5,363.2 | 5,267.0 | 5,099.6 |
| 2019 | 4,545.4 | 4,695.5 | 5,124.6 | 5,515.7 | 5,540.2 | 5,552.5 | 5,683.6 | 5,719.1 | 5,465.5 | 5,656.8 | 5,601.1 | 5,361.1 |
| 2020 | 4,823.5 | 5,079.6 | 4,770.1 | 4,005.9 | 5,007.2 | 5,696.5 | 5,758.9 | 5,601.4 | 5,521.6 | 5,443.4 | 5,199.2 | 5,232.8 |
| 2021 | 4,717.3 | 4,612.4 | 5,404.9 | 5,710.6 | 5,792.8 | 6,008.6 | 6,070.6 | 5,879.5 | 5,678.7 | 5,663.9 | 5,684.5 | 5,530.2 |
| 2022 | 4,851.0 | 4,937.0 | 5,392.1 | |||||||||
| - = No Data Reported; -- = Not Applicable; NA = Not Available; W = Withheld to avoid disclosure of individual company data. |
| Release Date: 5/19/2022 |
| Next Release Date: TBD |