|
Download Data (XLS File) |
|
||||||||
|
||||||||
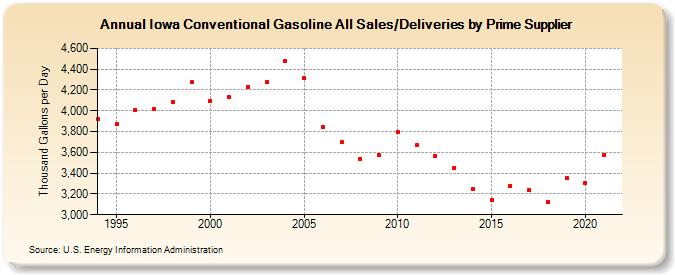
| Iowa Conventional Gasoline All Sales/Deliveries by Prime Supplier (Thousand Gallons per Day) | ||||||||
| Decade | Year-0 | Year-1 | Year-2 | Year-3 | Year-4 | Year-5 | Year-6 | Year-7 | Year-8 | Year-9 |
|---|---|---|---|---|---|---|---|---|---|---|
| 1990's | 3,920.9 | 3,870.9 | 4,005.6 | 4,017.1 | 4,080.0 | 4,272.0 | ||||
| 2000's | 4,096.3 | 4,132.8 | 4,229.3 | 4,272.3 | 4,480.6 | 4,314.0 | 3,843.0 | 3,696.9 | 3,535.2 | 3,571.0 |
| 2010's | 3,798.7 | 3,670.6 | 3,561.8 | 3,454.1 | 3,247.1 | 3,146.1 | 3,280.9 | 3,235.2 | 3,122.4 | 3,349.2 |
| 2020's | 3,305.0 |
| - = No Data Reported; -- = Not Applicable; NA = Not Available; W = Withheld to avoid disclosure of individual company data. |
| Release Date: 6/1/2022 |
| Next Release Date: TBD |