|
Download Data (XLS File) |
|
||||||||
|
||||||||
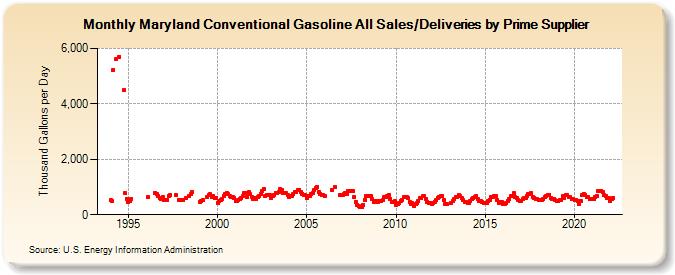
| Maryland Conventional Gasoline All Sales/Deliveries by Prime Supplier (Thousand Gallons per Day) | ||||||||
| Year | Jan | Feb | Mar | Apr | May | Jun | Jul | Aug | Sep | Oct | Nov | Dec |
|---|---|---|---|---|---|---|---|---|---|---|---|---|
| 1993 | NA | NA | NA | |||||||||
| 1994 | 515.9 | 507.5 | 5,226.6 | W | 5,635.3 | W | 5,700.2 | W | W | 4,488.2 | 766.5 | 582.2 |
| 1995 | 475.5 | 496.2 | 573.2 | W | W | W | W | W | W | W | W | W |
| 1996 | W | 632.9 | W | W | W | W | 797.4 | 743.7 | 678.7 | 592.5 | 559.3 | 640.8 |
| 1997 | 522.2 | 547.1 | 543.1 | 688.2 | 702.9 | W | W | W | 708.0 | W | 548.3 | W |
| 1998 | 522.1 | 514.3 | W | 599.1 | W | 683.1 | 736.7 | 810.1 | W | W | W | W |
| 1999 | 461.0 | 491.5 | 513.5 | W | W | 651.7 | 702.6 | 729.4 | 623.6 | 661.8 | 611.8 | 609.0 |
| 2000 | 437.3 | 492.7 | 537.1 | 567.0 | 670.8 | 737.1 | 786.9 | 741.7 | 677.7 | 647.3 | 638.6 | 595.3 |
| 2001 | 484.3 | 500.7 | 523.5 | 559.8 | 620.5 | 679.8 | 790.6 | 782.0 | 644.0 | 804.5 | 731.6 | 651.6 |
| 2002 | 579.1 | 615.9 | 579.0 | 630.6 | 666.2 | 763.1 | 844.3 | 923.5 | 677.7 | 714.1 | 725.9 | 698.4 |
| 2003 | 604.4 | 661.4 | 716.6 | 800.6 | 770.1 | 807.9 | 912.0 | 892.6 | 787.8 | 769.2 | 768.4 | 723.9 |
| 2004 | 646.0 | 664.6 | 687.0 | 732.1 | 836.4 | 817.0 | 874.2 | 892.4 | 815.1 | 761.6 | 728.1 | 710.0 |
| 2005 | 599.2 | 675.2 | 680.5 | 762.3 | 792.6 | 883.5 | 973.9 | 995.3 | 824.4 | 763.1 | 725.1 | 725.7 |
| 2006 | 664.6 | W | W | W | W | 901.5 | W | 1,008.5 | W | W | 707.8 | W |
| 2007 | 709.6 | 730.6 | 786.0 | 756.2 | 863.7 | 860.9 | 857.7 | 841.5 | 642.4 | 466.9 | 351.1 | 299.3 |
| 2008 | 281.3 | 271.0 | 362.8 | 542.0 | 672.9 | 668.3 | 688.4 | 667.8 | 555.0 | 459.4 | 502.7 | 495.9 |
| 2009 | 474.7 | 485.8 | 484.9 | 542.3 | 633.0 | 654.4 | 662.7 | 712.8 | 582.6 | 452.5 | 444.0 | 477.8 |
| 2010 | 364.1 | 381.0 | 419.4 | 503.7 | 539.7 | 622.8 | 652.2 | 642.6 | 586.0 | 475.1 | 392.4 | 421.1 |
| 2011 | 331.7 | 376.0 | 418.3 | 492.0 | 590.1 | 614.9 | 661.1 | 687.2 | 559.3 | 475.7 | 436.0 | 425.1 |
| 2012 | 371.8 | 408.4 | 472.3 | 517.9 | 613.5 | 653.2 | 675.3 | 672.8 | 539.4 | 374.4 | 372.3 | W |
| 2013 | W | 422.6 | 500.1 | 550.6 | 626.4 | 645.1 | 698.5 | 657.6 | 585.5 | 520.0 | 460.9 | 458.4 |
| 2014 | 434.9 | 424.5 | 503.7 | 553.7 | 602.6 | 652.4 | 671.5 | 575.0 | 511.3 | 484.2 | 457.6 | 424.6 |
| 2015 | 418.3 | 428.1 | 485.0 | 548.3 | 627.4 | 646.9 | 669.5 | 659.3 | 541.0 | 428.1 | 442.2 | 460.5 |
| 2016 | 395.4 | 403.0 | 407.2 | 496.4 | 557.5 | 660.9 | 672.6 | 767.3 | 648.4 | 590.8 | 528.2 | 499.7 |
| 2017 | 493.8 | 566.4 | 586.3 | 605.4 | 683.2 | 751.9 | 763.0 | 776.2 | 643.7 | 618.8 | 560.0 | 568.7 |
| 2018 | 515.4 | 545.3 | 543.0 | 575.1 | 638.2 | 658.7 | 721.1 | 722.4 | 620.8 | 560.6 | 558.2 | 518.5 |
| 2019 | 486.0 | 484.9 | 523.5 | 526.0 | 663.9 | 604.2 | 706.1 | 700.1 | 634.1 | 627.9 | 580.6 | 576.0 |
| 2020 | 518.1 | 534.2 | 492.4 | 387.6 | 501.9 | 695.6 | 749.6 | 715.9 | 648.3 | 634.5 | 552.8 | 550.7 |
| 2021 | 555.5 | 557.5 | 652.8 | 671.8 | 841.7 | 839.9 | 860.2 | 803.0 | 708.4 | 668.5 | 599.6 | 591.3 |
| 2022 | 503.9 | 558.8 | 606.3 | |||||||||
| - = No Data Reported; -- = Not Applicable; NA = Not Available; W = Withheld to avoid disclosure of individual company data. |
| Release Date: 5/19/2022 |
| Next Release Date: TBD |