|
Download Data (XLS File) |
|
||||||||
|
||||||||
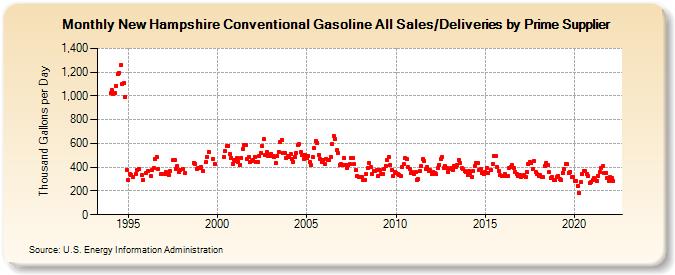
| New Hampshire Conventional Gasoline All Sales/Deliveries by Prime Supplier (Thousand Gallons per Day) | ||||||||
| Year | Jan | Feb | Mar | Apr | May | Jun | Jul | Aug | Sep | Oct | Nov | Dec |
|---|---|---|---|---|---|---|---|---|---|---|---|---|
| 1993 | NA | NA | NA | |||||||||
| 1994 | 1,020.4 | 1,046.9 | 1,018.6 | 1,025.5 | 1,087.2 | 1,180.7 | 1,194.9 | 1,260.7 | 1,099.9 | 1,108.5 | 994.3 | 374.4 |
| 1995 | 296.2 | 342.1 | 336.1 | 317.4 | W | 345.7 | 376.7 | 388.5 | W | 333.8 | 294.6 | W |
| 1996 | 348.4 | 367.4 | W | 327.5 | 379.3 | 392.6 | 464.8 | 489.0 | 383.4 | W | 346.6 | W |
| 1997 | 343.7 | 357.9 | 345.0 | 333.6 | 368.7 | W | 457.9 | 461.9 | 388.9 | 408.0 | 357.0 | 379.9 |
| 1998 | W | 382.8 | 350.0 | W | W | W | W | W | 439.5 | 430.4 | 383.7 | 394.9 |
| 1999 | 389.3 | 403.6 | 367.2 | W | 441.1 | 488.1 | 530.2 | W | W | 470.2 | 425.3 | W |
| 2000 | W | W | W | W | 484.6 | 533.3 | 574.6 | 582.5 | 511.7 | 481.5 | 429.6 | 463.5 |
| 2001 | 455.5 | 478.8 | 447.9 | 420.0 | 481.5 | 555.8 | 590.9 | 586.4 | 467.1 | 485.4 | 446.7 | 455.3 |
| 2002 | 457.2 | 486.1 | 440.1 | 444.5 | 493.9 | 520.1 | 578.0 | 633.4 | 505.1 | 530.9 | 494.9 | 494.1 |
| 2003 | 513.4 | 495.5 | 487.6 | 436.4 | 491.2 | 530.8 | 611.0 | 632.5 | 518.3 | 519.5 | 475.4 | 498.3 |
| 2004 | 484.7 | 508.7 | 468.6 | 447.9 | 486.6 | 521.4 | 586.3 | 592.4 | 526.6 | 505.3 | 471.3 | 501.6 |
| 2005 | 475.0 | 494.9 | 442.9 | 415.5 | 481.6 | 559.4 | 618.1 | 607.5 | 503.5 | 470.9 | 447.6 | 463.2 |
| 2006 | 424.2 | 471.7 | 460.5 | 460.1 | 490.0 | 598.9 | 665.9 | 634.1 | 540.9 | 521.4 | 418.7 | 427.6 |
| 2007 | 418.7 | 474.4 | 415.6 | 394.3 | 415.6 | 423.8 | 481.1 | 478.4 | 423.5 | 376.2 | 328.3 | 320.4 |
| 2008 | 317.8 | 316.5 | 288.0 | 291.1 | 341.5 | 391.5 | 434.1 | 397.7 | 346.2 | 371.8 | 369.0 | 375.7 |
| 2009 | 325.5 | 376.3 | 346.4 | 345.0 | 380.8 | 412.8 | 459.0 | 488.6 | 418.5 | 379.1 | 325.7 | 355.6 |
| 2010 | 351.2 | 346.5 | 335.5 | 325.1 | 402.3 | 424.7 | 479.4 | 465.9 | 398.4 | 387.0 | 347.5 | 359.2 |
| 2011 | 346.8 | 359.1 | 296.2 | 296.9 | 371.2 | 406.0 | 468.5 | 453.3 | 386.4 | 400.6 | 364.9 | 373.6 |
| 2012 | 340.4 | 360.4 | 351.3 | 340.2 | 389.2 | 419.4 | 468.3 | 487.0 | 396.4 | 411.1 | 395.4 | 360.7 |
| 2013 | 384.1 | 389.4 | 379.6 | 412.1 | 398.8 | 421.6 | 462.0 | 436.5 | 391.0 | 387.1 | 366.9 | 363.3 |
| 2014 | 334.1 | 365.8 | 349.2 | 320.2 | 367.0 | 409.5 | 432.9 | 434.8 | 380.5 | 383.9 | 351.4 | 338.6 |
| 2015 | 358.7 | 391.1 | 350.2 | W | 375.3 | 431.0 | 494.4 | 491.2 | 401.5 | 367.4 | 331.0 | 330.0 |
| 2016 | 323.7 | 342.8 | 325.3 | 325.3 | 394.7 | 403.0 | 415.9 | 397.4 | 356.6 | 340.0 | 323.4 | 331.4 |
| 2017 | 319.2 | 328.1 | 330.3 | 321.0 | 363.3 | 431.0 | 445.5 | 434.6 | 386.6 | 448.5 | 356.5 | 339.4 |
| 2018 | 326.9 | 331.3 | 315.7 | 314.3 | 413.1 | 438.5 | 417.4 | 357.5 | 313.2 | 316.2 | 291.4 | 295.7 |
| 2019 | 316.2 | 324.8 | 303.0 | 292.6 | 354.7 | 381.2 | 425.5 | 422.7 | 351.6 | 360.6 | 316.3 | 317.5 |
| 2020 | 285.8 | 285.8 | 244.2 | 183.6 | 272.5 | 340.5 | 369.7 | 370.4 | 344.3 | 325.5 | 263.2 | 275.3 |
| 2021 | 289.5 | 308.3 | 302.5 | 286.5 | 328.4 | 360.7 | 395.2 | 407.8 | 354.5 | 352.1 | 312.7 | 286.5 |
| 2022 | 316.9 | 310.8 | 284.8 | |||||||||
| - = No Data Reported; -- = Not Applicable; NA = Not Available; W = Withheld to avoid disclosure of individual company data. |
| Release Date: 5/19/2022 |
| Next Release Date: TBD |