|
Download Data (XLS File) |
|
||||||||
|
||||||||
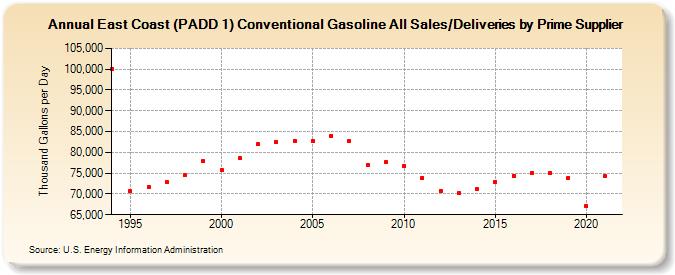
| East Coast (PADD 1) Conventional Gasoline All Sales/Deliveries by Prime Supplier (Thousand Gallons per Day) | ||||||||
| Decade | Year-0 | Year-1 | Year-2 | Year-3 | Year-4 | Year-5 | Year-6 | Year-7 | Year-8 | Year-9 |
|---|---|---|---|---|---|---|---|---|---|---|
| 1990's | 100,036.8 | 70,584.2 | 71,757.8 | 72,830.7 | 74,474.2 | 77,811.7 | ||||
| 2000's | 75,776.6 | 78,543.4 | 81,892.6 | 82,458.1 | 82,821.3 | 82,785.1 | 83,941.9 | 82,723.7 | 76,985.2 | 77,657.4 |
| 2010's | 76,831.9 | 73,915.3 | 70,731.6 | 70,152.5 | 71,099.9 | 72,928.3 | 74,419.7 | 75,076.4 | 75,050.1 | 73,879.1 |
| 2020's | 67,087.2 |
| - = No Data Reported; -- = Not Applicable; NA = Not Available; W = Withheld to avoid disclosure of individual company data. |
| Release Date: 6/1/2022 |
| Next Release Date: TBD |