|
Download Data (XLS File) |
|
||||||||
|
||||||||
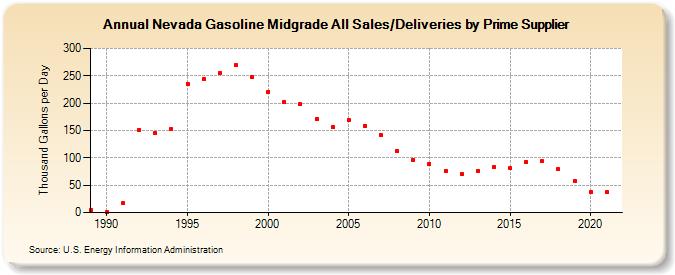
| Nevada Gasoline Midgrade All Sales/Deliveries by Prime Supplier (Thousand Gallons per Day) | ||||||||
| Decade | Year-0 | Year-1 | Year-2 | Year-3 | Year-4 | Year-5 | Year-6 | Year-7 | Year-8 | Year-9 |
|---|---|---|---|---|---|---|---|---|---|---|
| 1980's | 3.8 | |||||||||
| 1990's | 1.1 | 17.4 | 150.9 | 145.1 | 152.4 | 235.7 | 243.7 | 255.4 | 269.2 | 247.9 |
| 2000's | 220.8 | 201.5 | 197.9 | 170.9 | 155.5 | 169.0 | 158.7 | 142.2 | 112.3 | 96.7 |
| 2010's | 89.2 | 76.4 | 71.2 | 76.6 | 82.9 | 80.8 | 93.0 | 93.4 | 79.0 | 56.9 |
| 2020's | 37.3 |
| - = No Data Reported; -- = Not Applicable; NA = Not Available; W = Withheld to avoid disclosure of individual company data. |
| Release Date: 6/1/2022 |
| Next Release Date: TBD |